Getting started · 1:37
Your first chart
Learn how to open your first chart in EliteXCharts and set it up the way you trade, in under 2 minutes.
Chapters
Step by step
- Open a chart from Choose widget on an empty workspace, then click Choose instrument
- Browse the products by category, with each tick's value, and click NQ to see its contracts
- Pick the continuous contract: orders go to the current contract, and it rolls over by itself
- Star the symbols you trade most to keep them in the Favorites tab, one click away
- Choose how candles close (TimeFrame, Seconds, Renko, Tick, Delta), the size and the days of history
- Change the symbol or the chart type anytime from the chart header, for example from one minute to Renko
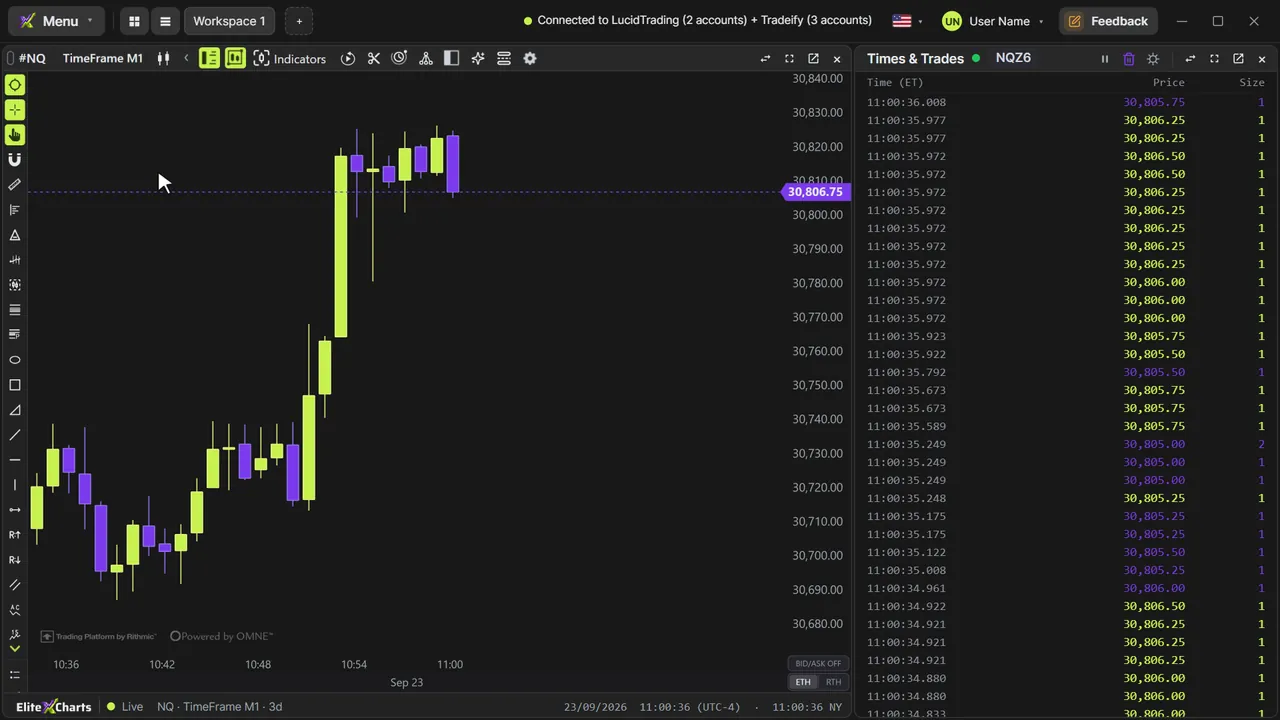
- Give two charts the same color group, and when you change the symbol in one, the other follows
What the narrator says
0:08Welcome to EliteXCharts. In this video, you'll open your first chart: choose the symbol, set the chart type and size, and link charts with color groups.
0:18On an empty workspace, click Choose widget and pick Chart. The new chart asks for a symbol, so click Choose instrument.
0:27The picker lists every product by category, with the value of each tick. Click NQ to see its contracts. The first one is the continuous contract, and it's the one we recommend: your orders go to the current contract, and it rolls to the next expiration by itself.
Read the full transcript
0:43Click the star to save it to Favorites. The symbols you trade most stay in their own tab, one click away.
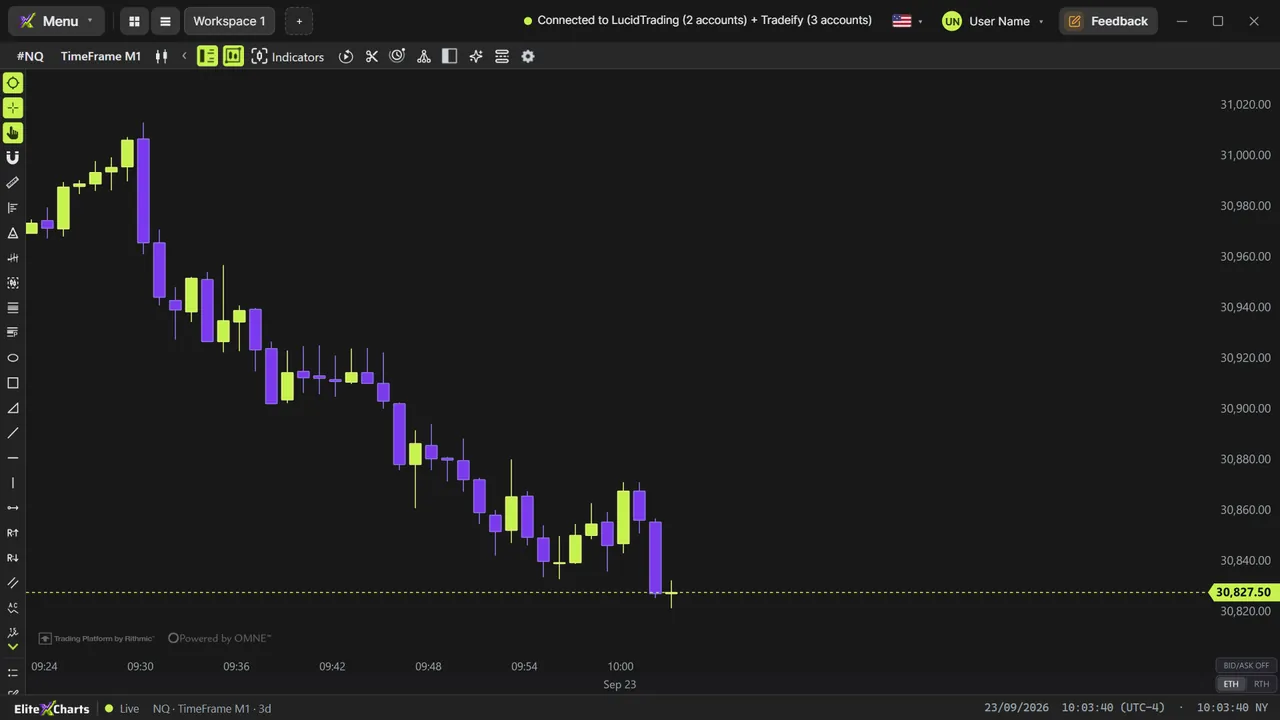
0:50Now choose how each candle closes. TimeFrame closes by the clock: one minute, five minutes, one hour. Seconds, Renko, Tick and Delta close in other ways, and each one has its own video. Pick the size, set how many days of history to load, and click Apply.
1:08You can change it all later, right on the chart header. Click the symbol to swap it, and click the type to switch it, for example from one minute to Renko.
1:17Using more than one chart? Color groups link them. Click the marker in the corner of the chart header and pick a color. Give two charts the same color, and when you change the symbol in one of them, the other one follows.
1:31That's your first chart, set up the way you trade.