Order flow · 2:24
Absorption
Learn to see where aggressive orders hit, and which side held them, with the EliteXCharts Absorption indicator, in under 3 minutes.
Chapters
Step by step
- Turn on Absorption from Indicators on the chart header: open Flow and click the arrow next to it
- Learn what a bar marks: a 10-tick block with a delta of at least 40 contracts and 70% of its volume
- Tell who held by the color: violet means sellers held the buying, lime means buyers absorbed the selling
- Watch the bars appear live, block by block, and read the label: the delta and the purity
- See why a bar never disappears: it keeps its peak, even when buying comes back into the block
- Spot the broken blocks: if the candle closes beyond a block, the bar freezes in dashed gray
- Open the gear to set the minimum delta, block size, purity, days, colors, bar format and sound alert
- Check the book on the label when live: how many times the level was refilled, and how much rests there
What the narrator says
0:08Welcome to EliteXCharts. In this video, you'll learn the Absorption indicator: where aggressive orders hit, and which side held them.
0:16To turn it on, click Indicators on the chart's header, open Flow, and click the arrow next to Absorption. Close the window, and the bars show up on your chart.
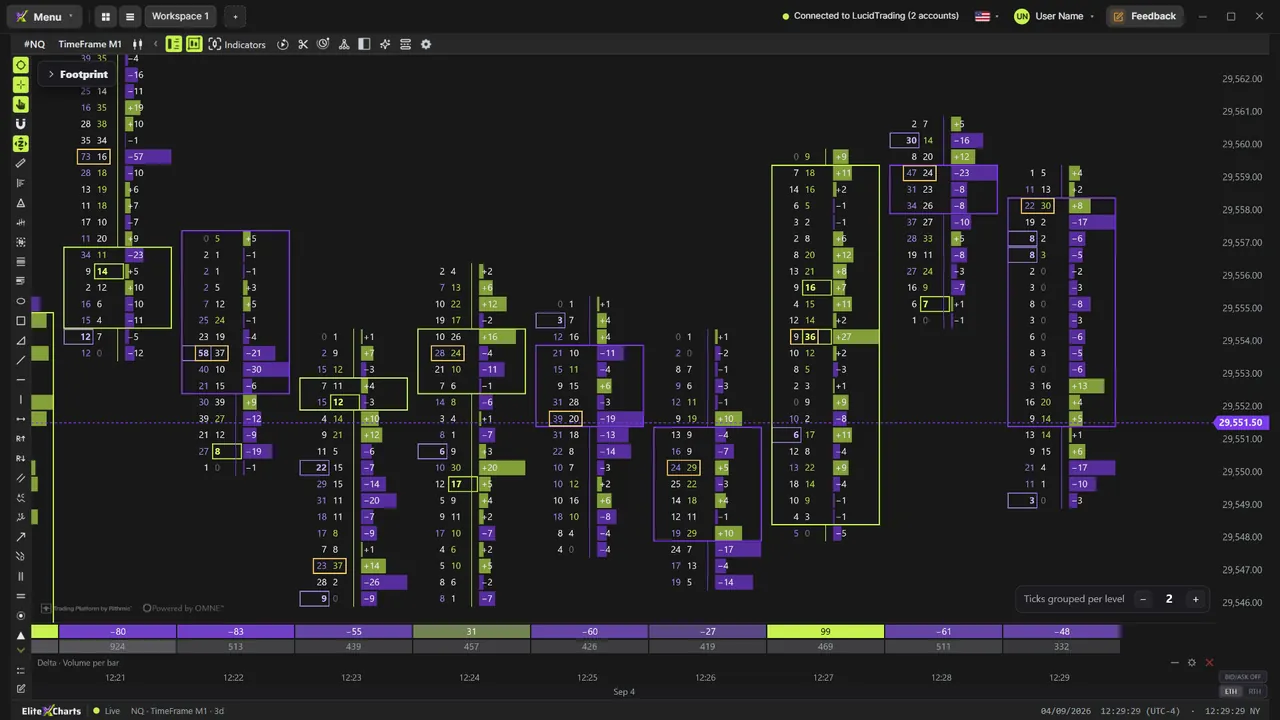
0:26Each bar marks a block of ten ticks inside one candle, where aggressive orders hit hard, and from one side. The block's delta, buys minus sells, must reach at least 40 contracts, and be at least 70% of the block's volume. Like this one, appearing now.
Read the full transcript
0:46The color tells you who held. Violet: buyers were hitting, and sellers held them back. Lime: sellers were hitting, and buyers absorbed it.
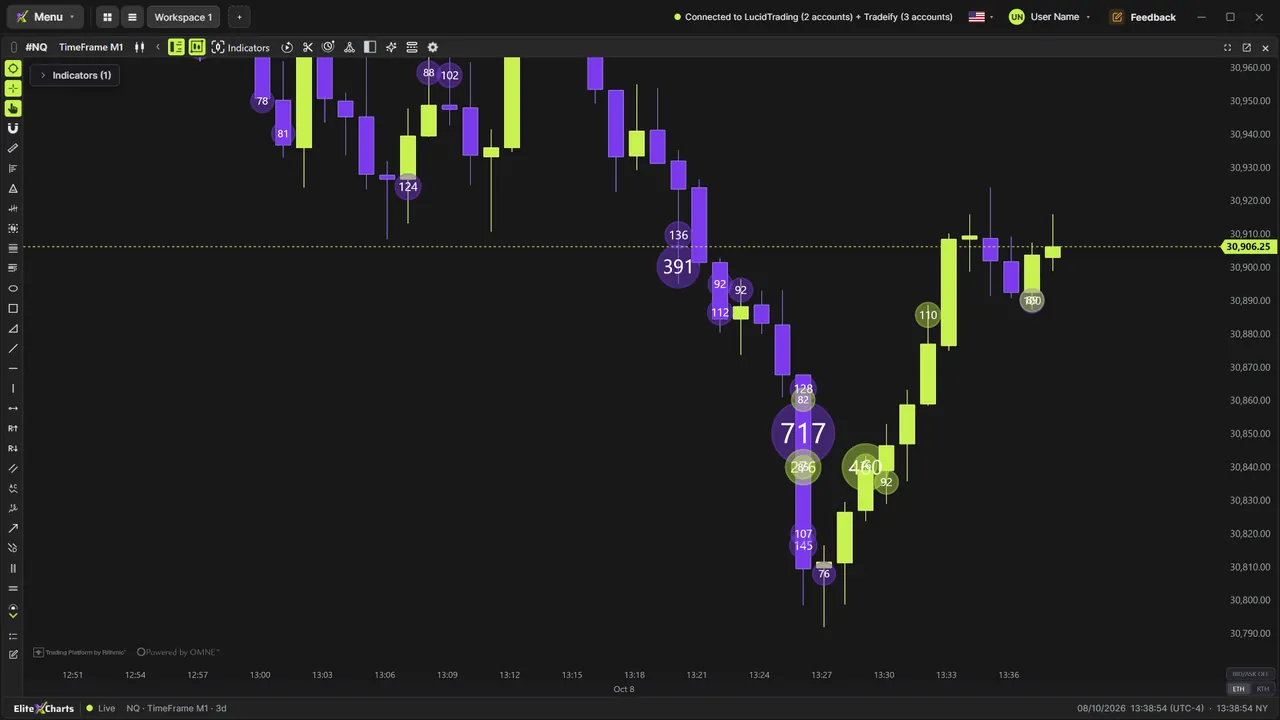
0:57Now watch it live. Selling speeds up, and lime bars appear block by block, with buyers holding each level.
1:06The label shows the delta and the purity: here, −63, and 91%. Each bar grows to the right as its delta builds, behind the candles, so the price stays readable. Until the candle closes, the bars are still active.
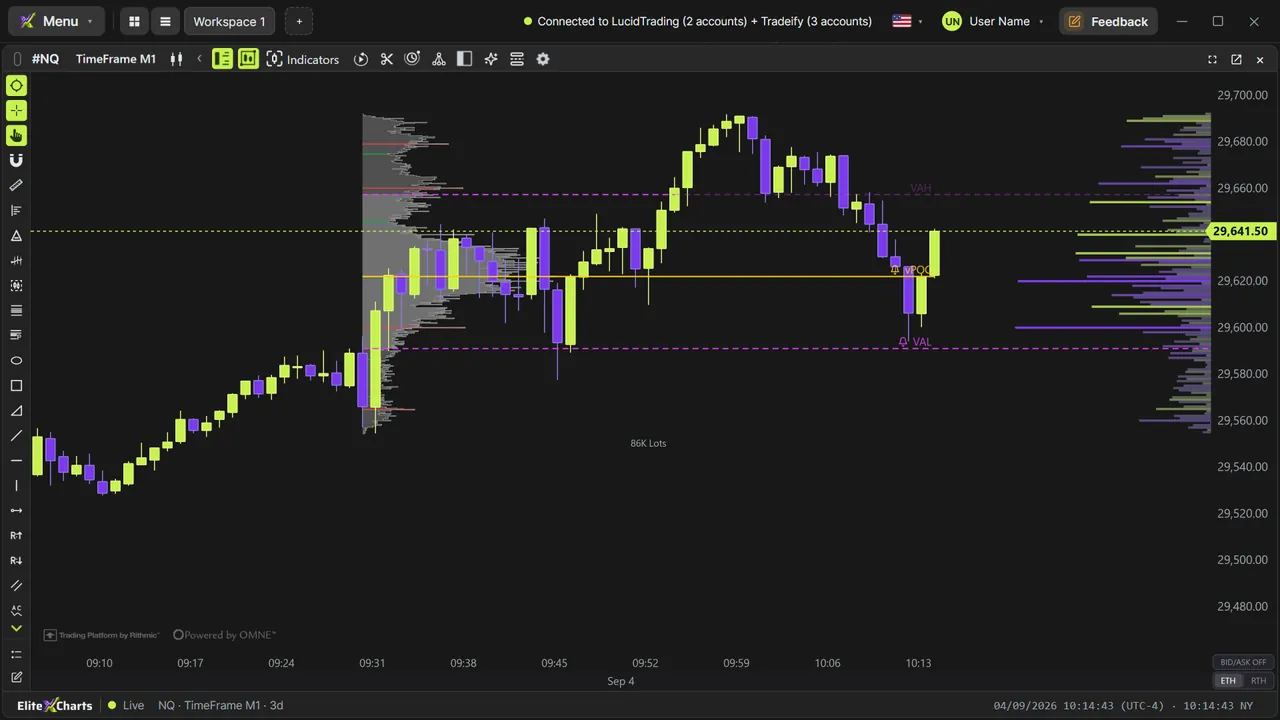
1:23At 29,600, buyers absorb again. And a bar never disappears: it keeps its peak. Watch: buying comes back into this block, but the bar stays.
1:34Then the candle closes. If it closes beyond a block, the price got through: the bar freezes in dashed gray, with just the delta. Here, the top three broke, and the one at 29,600 held.
1:48To adjust it, click the gear next to Absorption in the chart's indicator list. In Detection, you set the minimum delta, the block size in ticks, the minimum purity, and how many days to show. Then come the colors, the bar format, thin, full, or segments, and a sound alert for every new bar.
2:06On a live connection, the label can also show the book: how many times the order holding the level was refilled, and how much is resting there now.
2:16That's Absorption in EliteXCharts: where the aggression hit, and who held it.