Order flow · 1:52
Volume Profile & Delta Profile
Learn to draw and read the Volume Profile and the Delta Profile in EliteXCharts, in under 2 minutes.
Chapters
Step by step
- Draw a profile with the Volume Profile tool; end it on the current candle and it follows the market
- Read the POC, the price with the most volume, and the value area, where 70% of the volume traded
- Drag either edge to change the range, double-click to edit the profile, and press Delete to remove it
- See the delta at each price, lime for buyers and violet for sellers, and set its side in the Delta tab
- Aggregate the delta to two, three or four ticks per bar, and save your settings as a template
- Use the session indicators: a Volume Profile on every session, up to 30 days back, and the Delta Profile
- Watch a real NQ session where price leaves the value area at 10:40 and falls another 70 points
What the narrator says
0:08Welcome to EliteXCharts. In this video: the Volume Profile and the Delta Profile. How much traded at each price, and who was the aggressor there.
0:18Pick the Volume Profile tool on the left toolbar. Click the first candle of the range, here the New York open, then the last one. If it ends on the current candle, it keeps following the market.
0:29Each bar is the volume traded at that price. The point of control, the POC, is the price with the most volume. Around it, the value area holds seventy percent of the volume, between the value area high and low.
Read the full transcript
0:43Drag either edge to change the range. Double-click the profile to edit it, and press Delete to remove it.
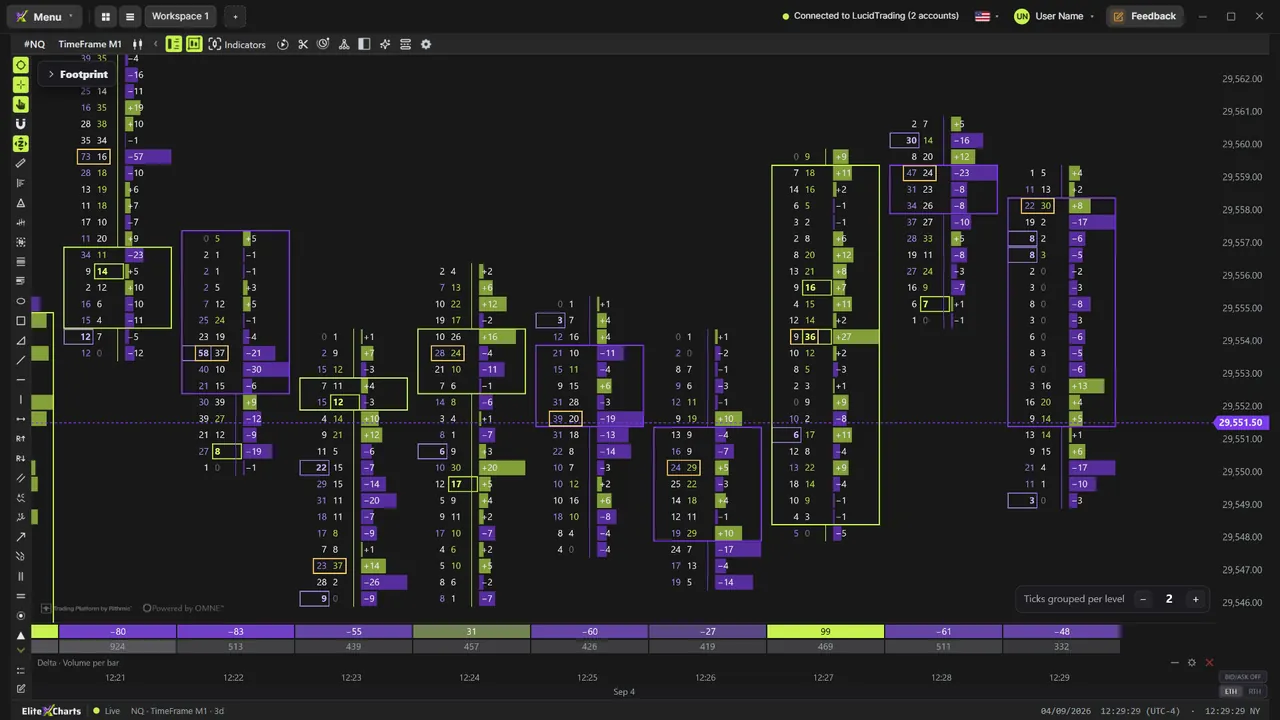
0:50The delta shows, at each price, buyers minus sellers: lime where buyers were more aggressive, violet where sellers were. In the Delta tab, put it on the left or on the right.
1:02On a busy chart, aggregate it: two, three or four ticks per bar. And save your settings as a template, to reuse them on any chart.
1:11Want a profile on every session, automatically? The Volume Profile indicator anchors to each session: the full day, New York hours or overnight, up to thirty days back. And the Delta Profile indicator shows only the delta, on the side, for the whole day or the last minutes.
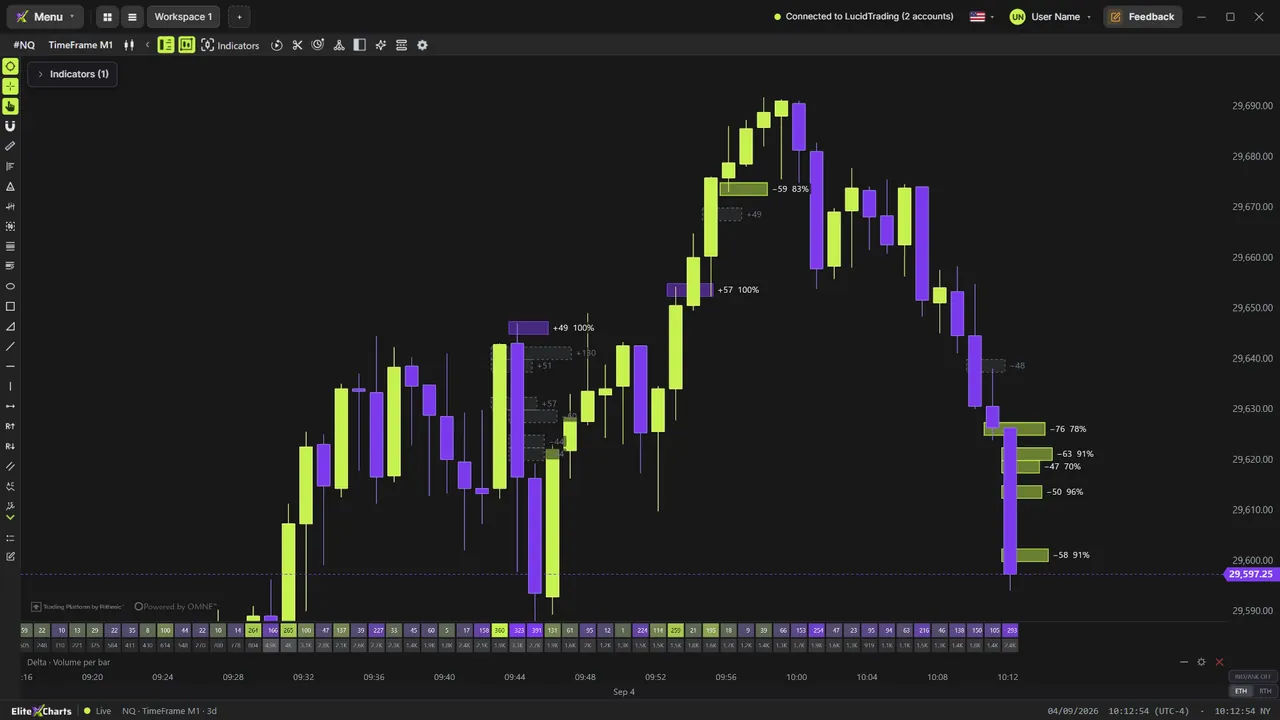
1:29A real session. Price spends the morning around the POC. Then, at ten forty, it leaves the value area below the low, with big sellers hitting, and falls another seventy points.
1:41That's the Volume Profile and the Delta Profile: draw it over any range, read the POC and the value area, and let the delta show who was in control.