Order flow · 2:45
Footprint explained
Learn to read every candle from the inside with the EliteXCharts footprint, and set it up your way, in under 3 minutes.
Chapters
Step by step
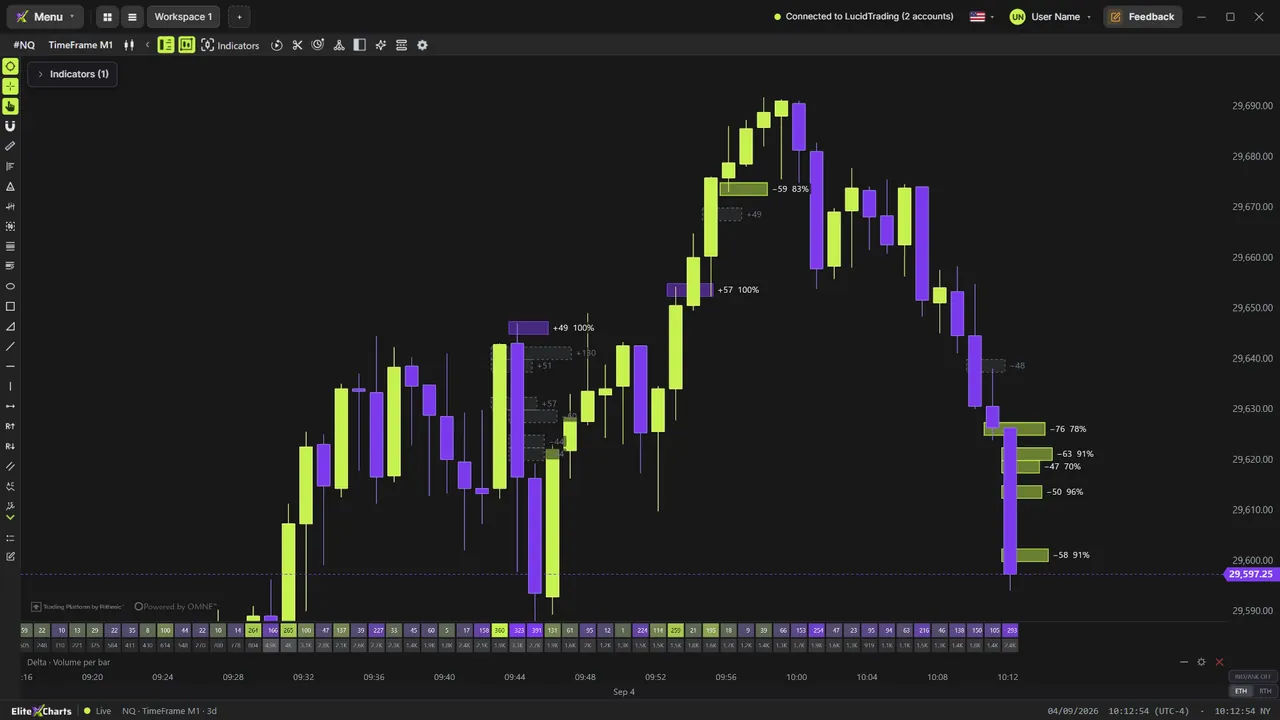
- Zoom in until the footprint opens by itself, ready to read, with the Delta · Volume per bar pane below
- Read bid × ask at each price: contracts sold at the bid on the left, bought at the ask on the right
- Spot imbalances: numbers colored on the diagonal, bold and outlined when one side trades 3× more
- Read the framed candle, the POC in a yellow box and the delta profile in the second column
- Change Ticks grouped per level from the chart corner: NQ opens with 2, from 1 up to 4 here
- Follow each candle's delta, on a heat scale, and volume in the Delta · Volume per bar pane
- Switch between the 13 ready-made versions in one click, with a caption on hover
- Pick 1 to 4 columns per bar, keep the reading as you zoom, and open the full menu for everything else
What the narrator says
0:08Welcome to EliteXCharts. In this video, you'll learn the footprint: what it shows inside every candle, and how to set it up your way.
0:17The Footprint button on the chart header is on by default. Zoom in, and the footprint opens by itself as soon as the numbers fit, ready to read. The Delta · Volume per bar pane opens with it, below the chart.
0:30Each row is a price. In the first column, bid by ask: on the left, the contracts sold at the bid by aggressive sellers. On the right, the contracts bought at the ask by aggressive buyers.
Read the full transcript
0:42The numbers wear the color of whoever is winning, compared on the diagonal: buyers in lime green, sellers in violet. When one side trades at least three times more than the other, the number turns bold and the cell gets an outline. That's an imbalance.
0:57The candle is drawn as a frame around its own levels, with the wick coming out of the middle. The yellow box marks the POC, the price with the most volume. And the second column is the delta profile: a bar at each price, lime when buyers won, violet when sellers did.
1:13In the chart corner, Ticks grouped per level. On the Nasdaq it opens with two ticks per level. Press minus, and every tick is its own row: dozens of thin rows. Press plus up to four: one point per cell, bigger numbers, the same volume. Then back to two.
1:31Below the chart, the Delta · Volume per bar pane sums it up candle by candle: the delta on top, on a heat scale, and the volume underneath.
1:40Hover the Footprint menu in the chart corner: it opens, and the bar with the thirteen versions shows up below the chart. Point at one and a caption explains it. Click, and the whole footprint changes: the volume profile inside the candle, the delta profile, bid by ask as a profile, or box mode. Same data, thirteen ways to read it.
2:00In the same menu, Columns per bar goes from one to four. Each column shows what you choose: bid by ask, volume, delta, or delta with total volume, as boxes or as a profile. One click on version one, and everything is back.
2:15And the footprint holds as you zoom. Once it's on, it only turns off when you're about three times further out than where it came in, so nudging the zoom never drops the reading.
2:25Everything else is in that same menu, section by section: data, grouping ticks, box background, number colors, markers, text, candle and columns. Scroll through it, and every change redraws the footprint right away.
2:40That's the footprint in EliteXCharts.