
Flow
Absorption
Absorption: aggression that does NOT move price — Big Trades' sibling, but for whoever is HOLDING.
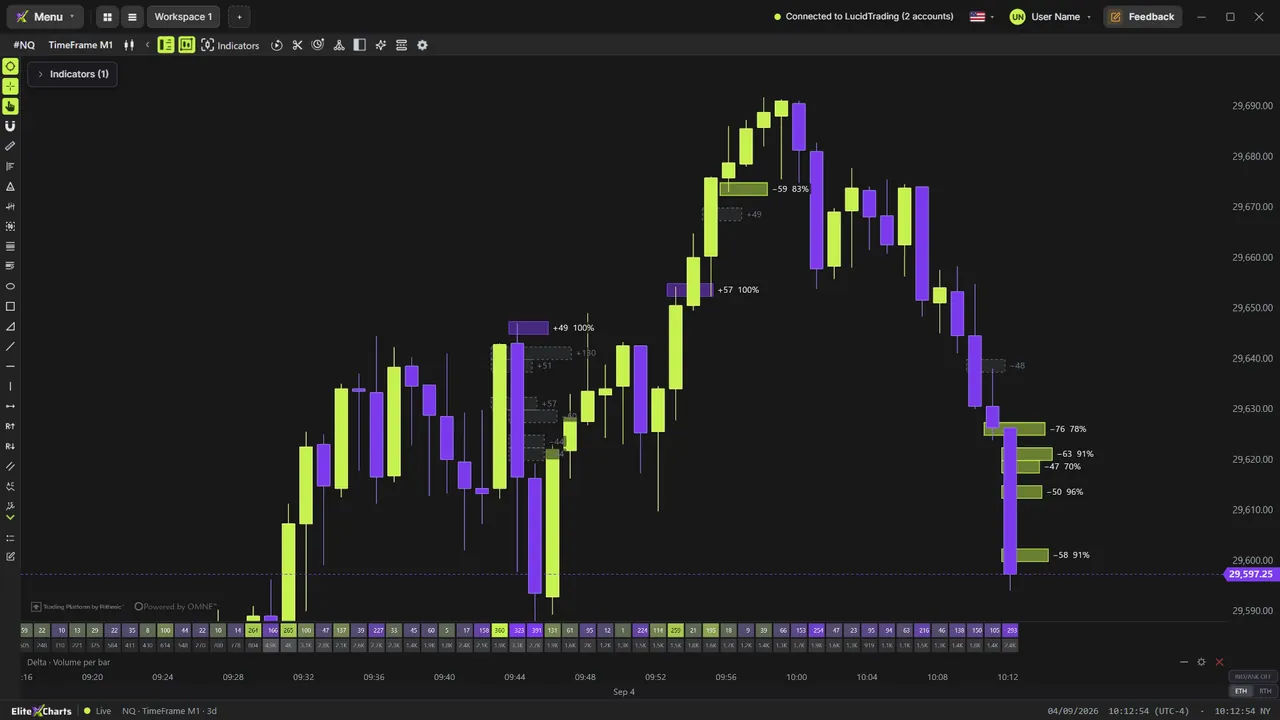
Real example in the platform
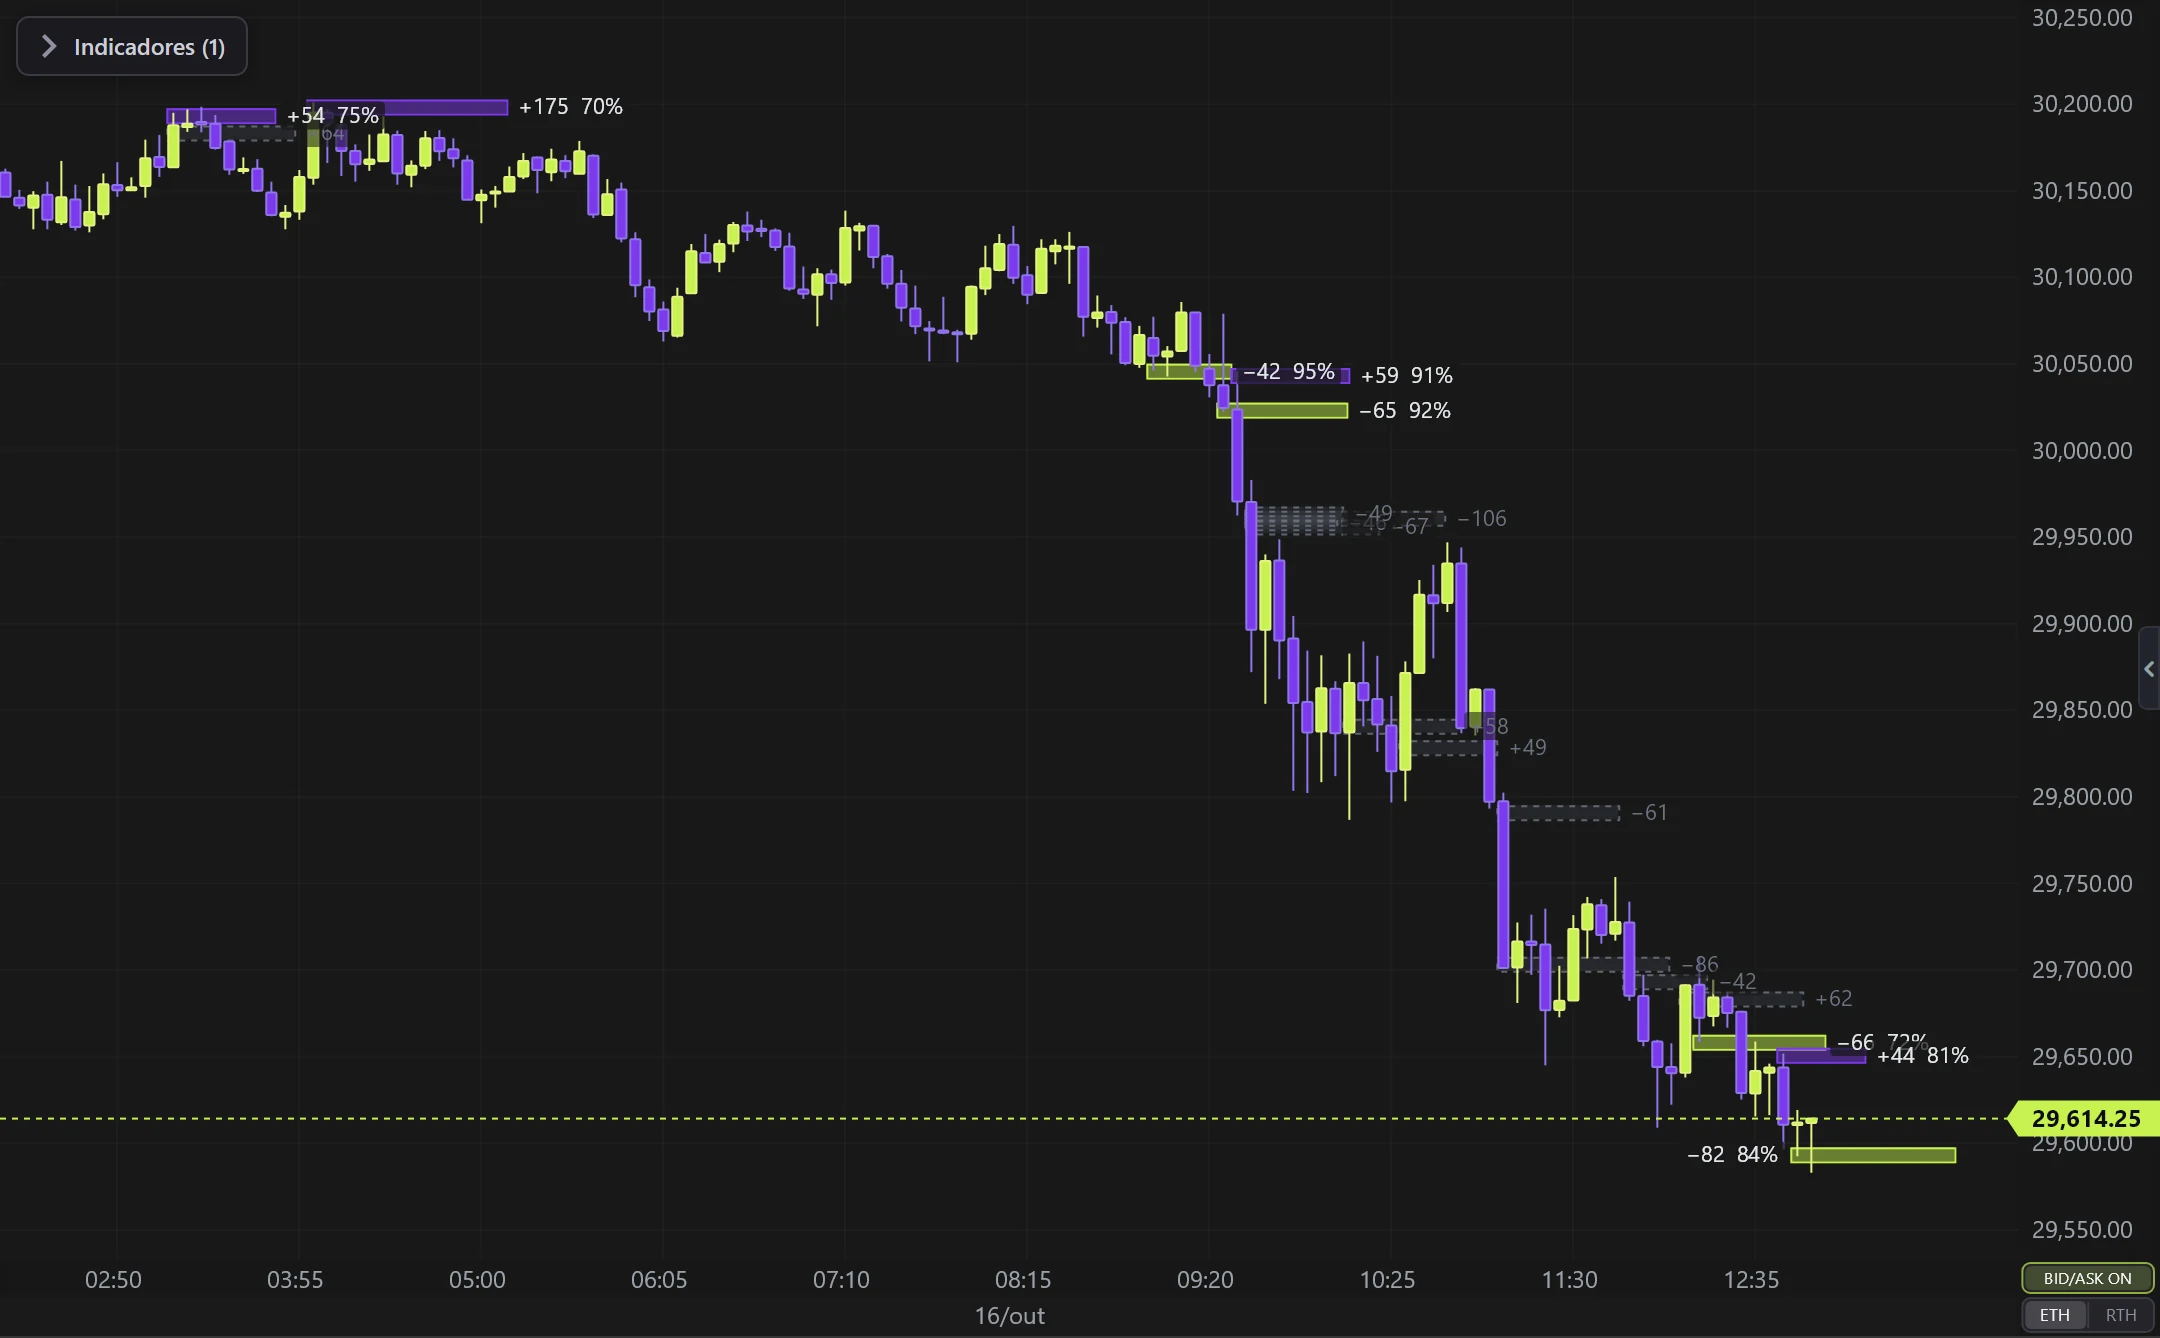
Absorption on the NQ, 5-minute candles built from real ticks (October 16, 2026, Rithmic feed) — a screenshot of the platform itself, factory settings.
What it does
- Uses the footprint DELTA (aggressive buying − aggressive selling) per price level, or per block of N ticks grouped exactly like the grouped footprint — you can check the number in the cell.
- When a block's delta passes the minimum, a horizontal BAR is born in the block and grows to the right as the delta fills. Once created, the bar does NOT disappear: it keeps the peak (it can fill more, but it does not vanish if opposite aggression swallows the delta later) — it is the trail of the areas where absorption happened.
- Purity: the delta must be at least X% of the block volume — an even fight with huge volume is not absorption.
- Broken only if the candle CLOSES beyond the block (buyers absorbed and close above; sellers and close below): it freezes in gray. In the current candle the bar stays active until the close.
- Color of WHO HOLDS (the passive side, the stronger one): buyer delta = seller held → violet · seller delta = buyer held → lime.
- Live, level 1 of the book counts the refills (↻) of the holding side and shows what is exposed; no book recording — the summary is cached so it survives closing and reopening.
Options
- Minimum delta, aggregation (ticks), purity (%), days, show broken, shape (thin · full · segments), px per 100 contracts, height, colors, book, sound alert.
Settings
Everything you can change in the indicator's settings dialog, in the same order as in the platform:
- Detection
- Days (sessions) — last ones only, max 30
- Minimum delta for the bar to appear (contracts, buy − sell)
- Aggregation (ticks) — blocks like the grouped footprint; 1 = per level
- Minimum purity (% of the block volume; 0 = no filter)
- Show broken ones (gray)
- Colors
- Held the buyers (passive seller)
- Held the sellers (passive buyer)
- Broken
- Visual
- Format
- Thin bar (label outside)
- Full bar (volume inside + book at the tip)
- Segments (N contracts each)
- Length: px per 100 contracts
- Maximum length (px)
- Contracts per segment
- Minimum height (px)
- Opacity
- Show volume
- Show purity (%)
- Book refresh (live only)
- Show refills and what is exposed at level 1 (book)
- Minimum refill to count a refresh (lots)
- Alerts
- Sound alert when a bar appears
How to add it in EliteXCharts
- Open a chart and click the Indicators icon in the chart header.
- Pick the Flow category and choose Absorption.
- Click Add. Double-click the indicator (or use its gear) to open the settings.
- Or ask the AI Assistant: "add the Absorption".
Frequently asked questions
What does the Absorption indicator do?
Absorption: aggression that does NOT move price — Big Trades' sibling, but for whoever is HOLDING. Uses the footprint DELTA (aggressive buying − aggressive selling) per price level, or per block of N ticks grouped exactly like the grouped footprint — you can check the number in the cell. When a block's delta passes the minimum, a horizontal BAR is born in the block and grows to the right as the delta fills. Once created, the bar does NOT disappear: it keeps the peak (it can fill more, but it does not vanish if opposite aggression swallows the delta later) — it is the trail of the areas where absorption happened. Purity: the delta must be at least X% of the block volume — an even fight with huge volume is not absorption.
How do you read the Absorption?
Minimum delta, aggregation (ticks), purity (%), days, show broken, shape (thin · full · segments), px per 100 contracts, height, colors, book, sound alert.
How do I add the Absorption to a chart in EliteXCharts?
Open a chart and click the Indicators icon in the chart header. Pick the Flow category and choose Absorption. Click Add. Double-click the indicator (or use its gear) to open the settings. Or ask the AI Assistant: "add the Absorption".
Related indicators
Big Trades
Marks the LARGE trades on the chart (ATAS-style sweep).
real screenshotTrend Pressure
Trend line driven by PRESSURE (EMA base + pressure×ATR) with signals.
real screenshotRSI Levels
Support/resistance created by RSI CROSSES.
real screenshotDelta Profile
DELTA profile (buy − sell per price) anchored to the side.
real screenshotTry it on your own chart
Every feature on every plan — 6 months, 1 year or lifetime.
See plans & pricing