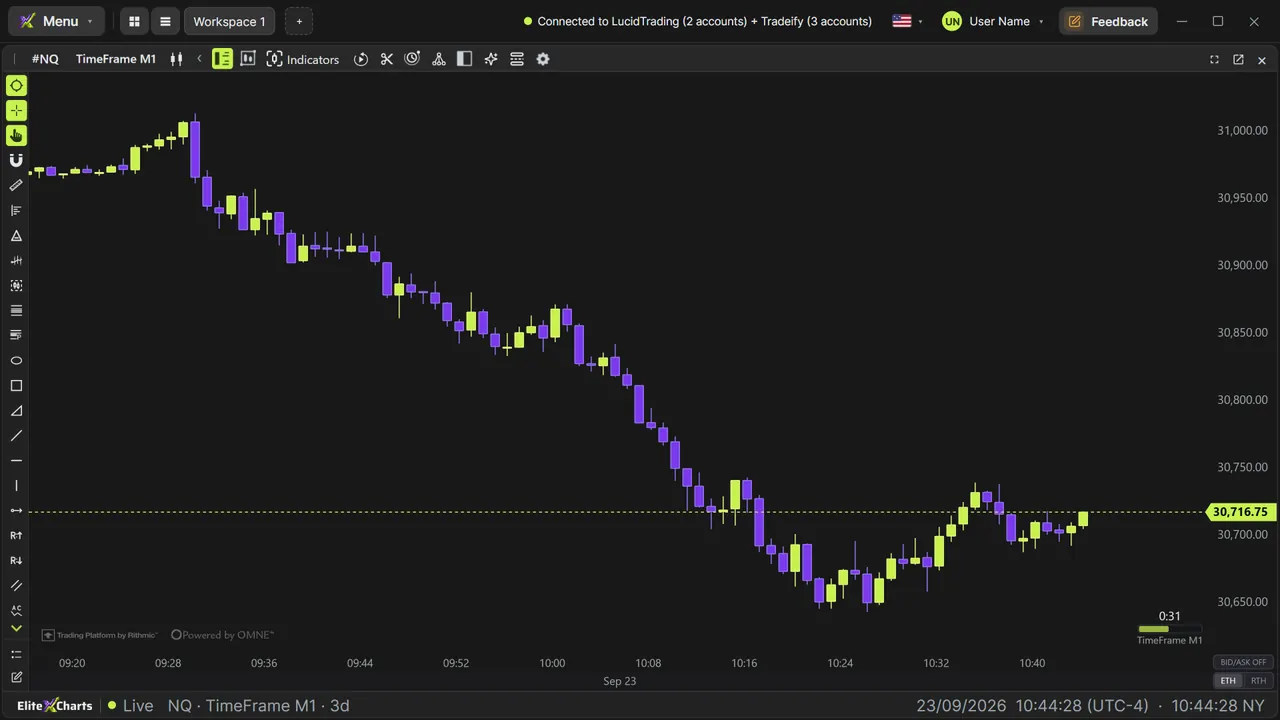
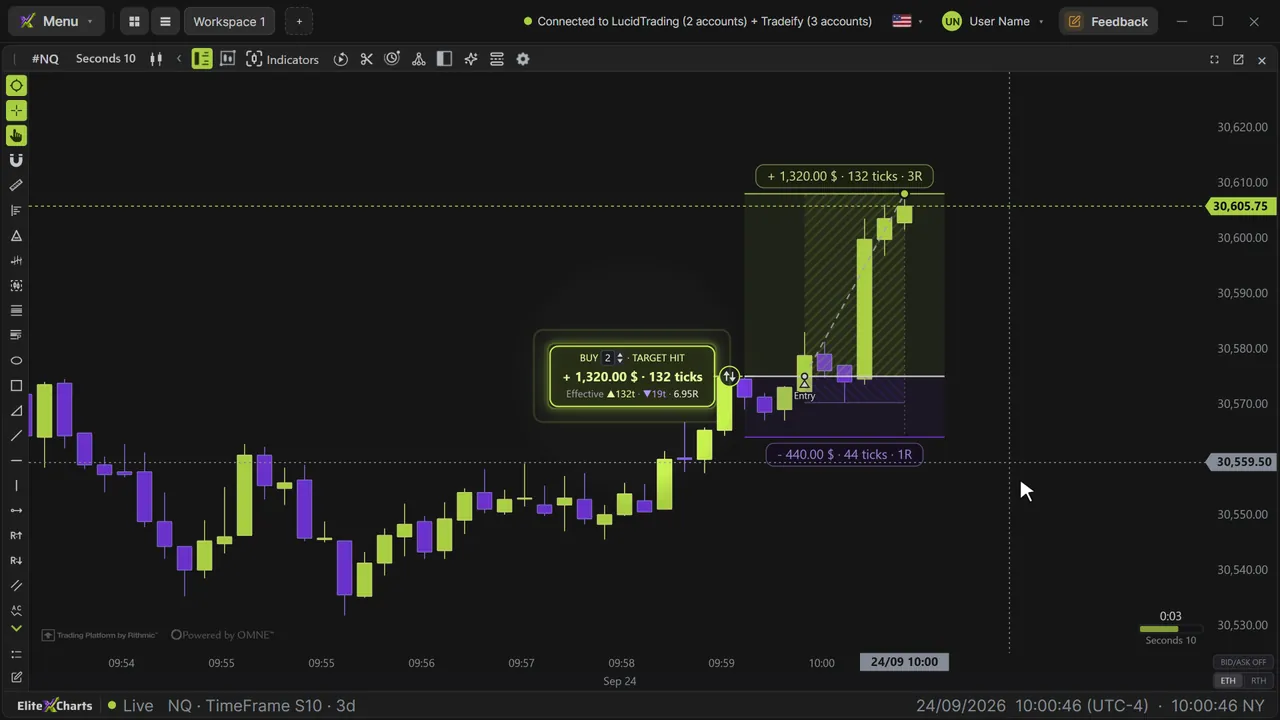
Charts & analysis · 2:26
Drawing tools
Learn to draw lines, zones and Fibonacci with alerts, measure moves and save your styles in EliteXCharts, in under 3 minutes.
Chapters
Step by step
- Find the drawing tools on the bar to the left of the chart: click one, draw, and it turns off by itself
- Turn on the OHLC magnet so every point snaps to the open, high, low or close of the nearest candle
- Mark a level with the horizontal line and a zone with the rectangle
- Measure any move with the ruler: points, ticks, percent and bars
- Draw a Fibonacci retracement, with the golden pocket from 61.8% to 65% highlighted
- Get a sound and a card when price touches the 50% and 61.8% levels, which come with a bell
- Double-click a drawing to edit its coordinates, thickness and style, extend it and add a label
- Save templates per tool, make a drawing global and move it on every NQ chart at once, and use Chart objects
What the narrator says
0:08Welcome to EliteXCharts. In this video, you'll see the drawing tools: lines and zones, the ruler, Fibonacci with alerts, labels, the magnet and templates.
0:19The tools are on the bar to the left of the chart. Start with the magnet: when it's on, every point you place snaps to the open, high, low or close of the nearest candle.
0:30Click a tool and it lights up. The horizontal line takes one click. This level, near 31,200, held the market back for ten minutes. Once you draw, the tool turns itself off.
Read the full transcript
0:42A rectangle takes two clicks, on opposite corners. Use it to mark a zone, like the range the market built right after the open.
0:50The ruler measures any move: click A, then B, for points, ticks, percent and bars. This rally was 145 points in 22 bars. To remove a drawing, select it and press Delete.
1:04For a Fibonacci retracement, click where the move started, then where it ended. The levels appear between the clicks, and the golden pocket, from 61.8 to 65 percent, is highlighted.
1:15The 50 and 61.8 percent levels come with a bell. When price touches one, the platform plays a sound, and a card pops up in the corner.
1:26A line takes two clicks: from the opening low to the low price just made, inside the golden pocket.
1:33Double-click a drawing to open its settings: the exact coordinates first, then color, thickness and style. Extend the line to the right, and give it a label.
1:43Save template keeps this style for every new line.
1:47Now open a second NQ chart: the plus on the tab bar, Chart, and NQ. Then auto-arrange the workspace, side by side.
1:57Drawings belong to their own chart. Make one global, and it shows up on every NQ chart, on any timeframe.
2:04Drag it on one chart, and it moves on the other, live.
2:09Chart objects, at the bottom of the bar, lists everything you've drawn: hide, lock, rename or delete, one by one or all at once.
2:18That's drawing tools in EliteXCharts: mark your levels, and let the chart do the measuring.