
Flow
Volume Profile / Delta
The Volume Profile tool as an INDICATOR, anchored to the session.
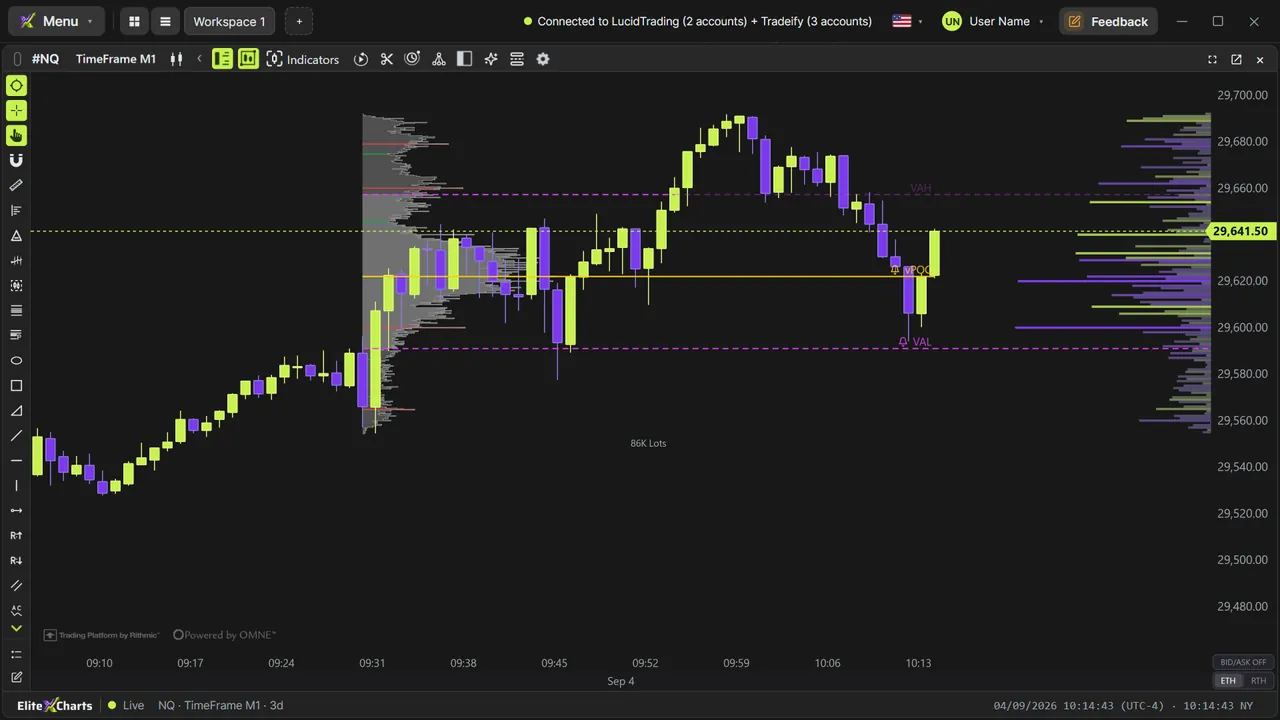
Real example in the platform
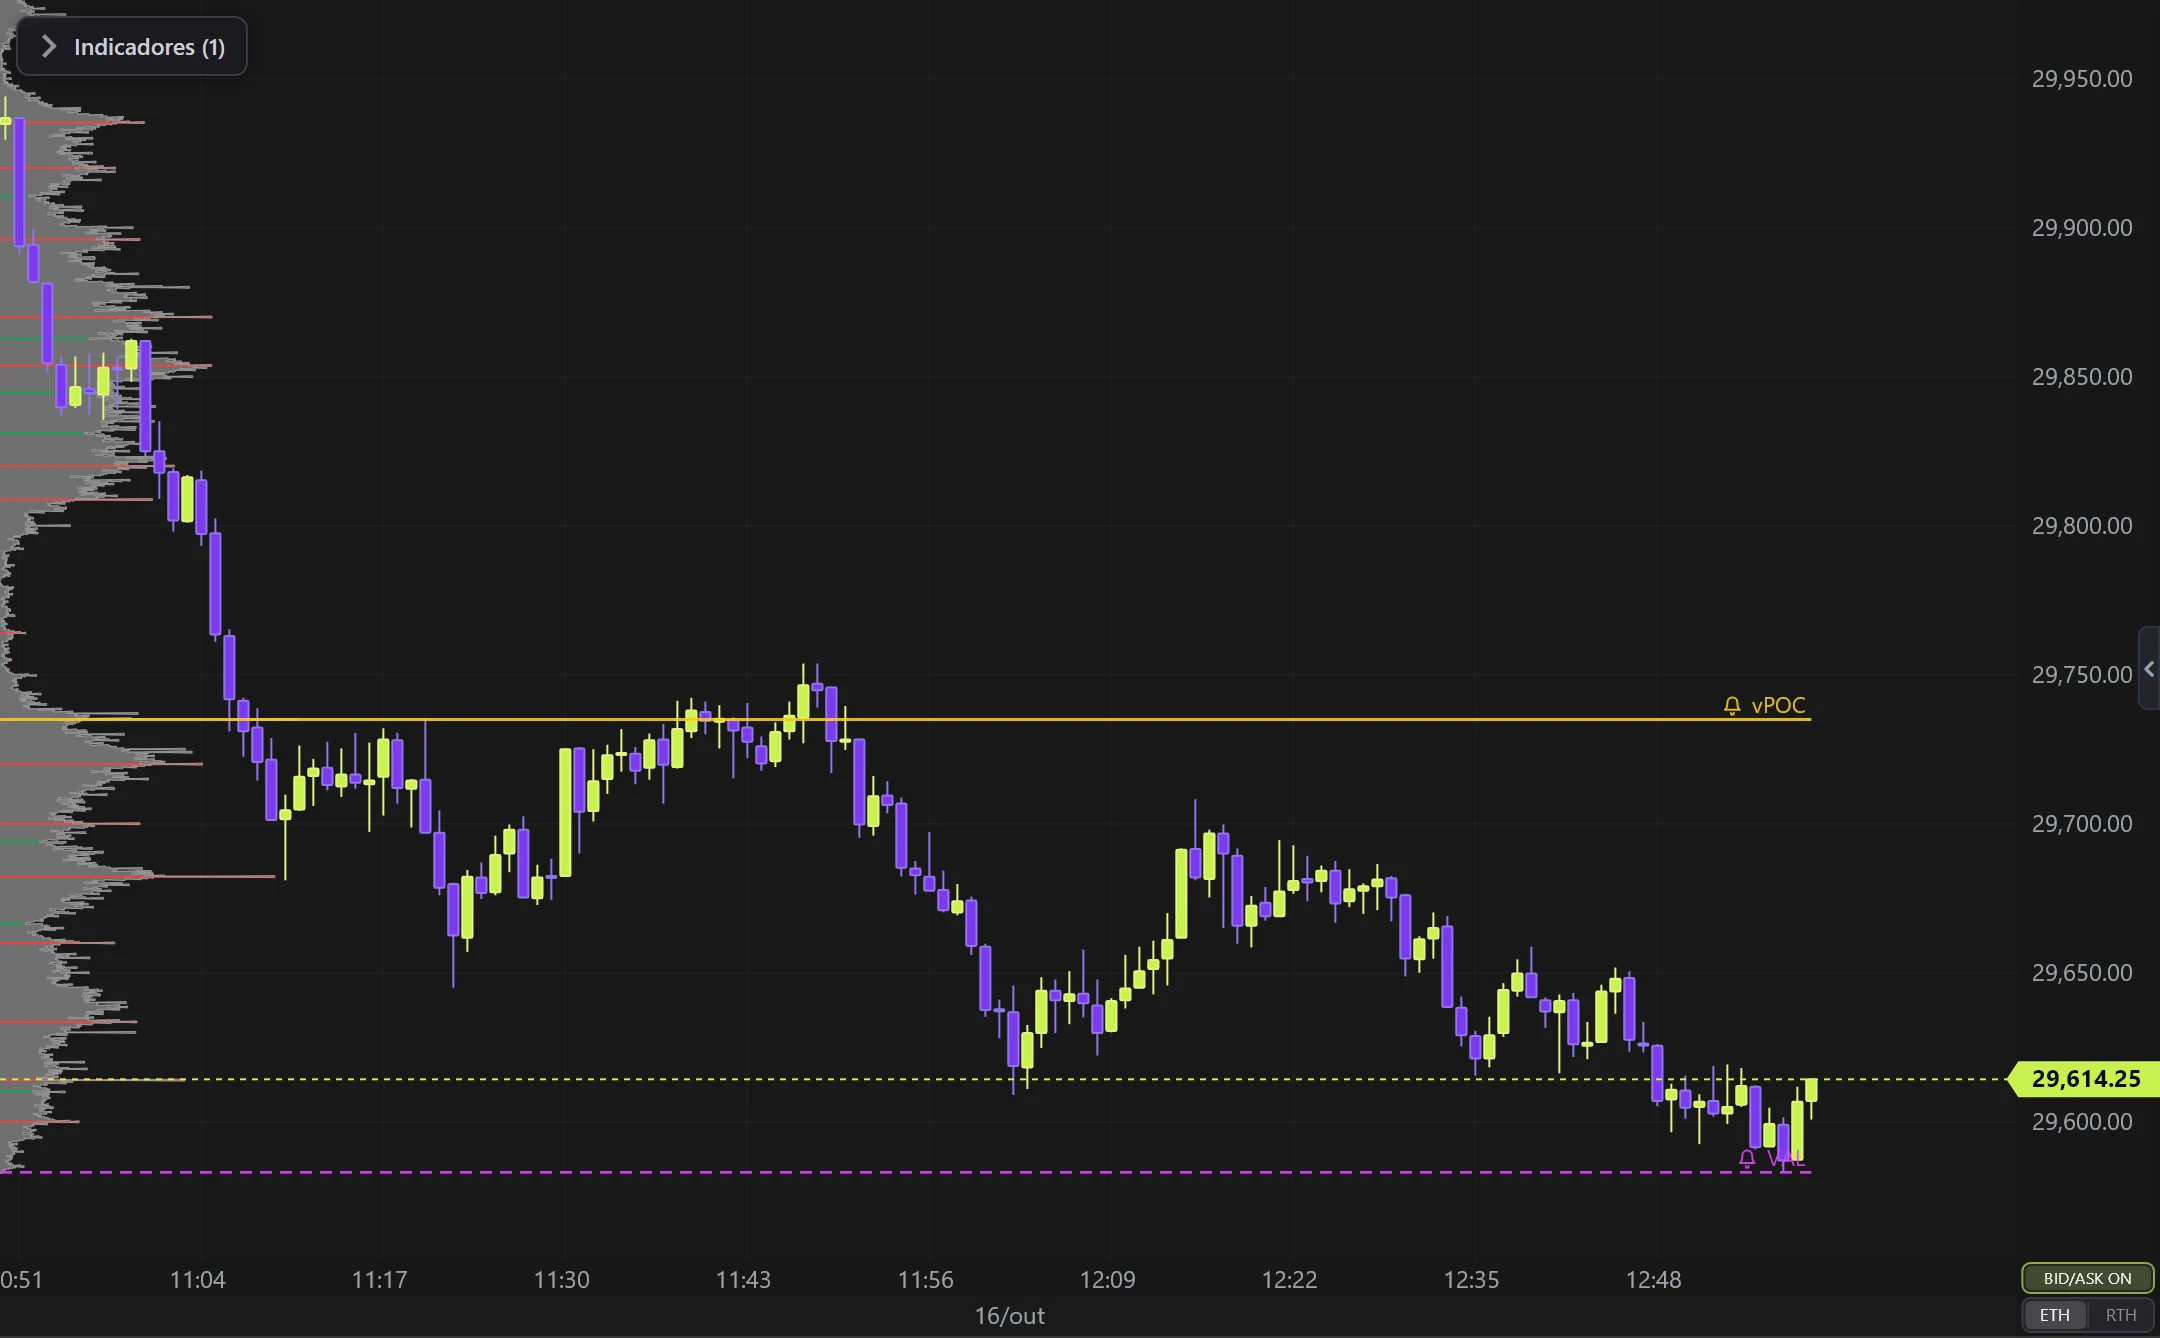
Volume Profile / Delta on the NQ, 1-minute candles built from real ticks (October 16, 2026, Rithmic feed) — a screenshot of the platform itself, factory settings.
What it does
- ALL of the tool's features: histogram, POC/VAH/VAL, silhouette, volume highlights (peaks), full DELTA and level text.
- PERIOD: full session (18:00→17:00) · RTH only (9:30–16:00) · ETH only (overnight).
- Up to 30 days of profiles (one per session); re-anchors on every candle and at day rollover.
- Untouchable on the chart: clicks pass through (the hand drags as usual).
Options
- Volume Profile and Delta tabs with every tool setting + width as % of the session (zoomed out).
Settings
Everything you can change in the indicator's settings dialog, in the same order as in the platform:
- Always within session (anchored) — extend does not apply.
- Session
- Period
- Full day
- RTH only
- ETH only
- Days
- ⚠︎ Aggregating volume ticks changes the Value Area (VAH/VAL) and the POC
- General
- Aggregation
- Max width (px)
- Max width (%)
- Volume colors
- Color inside VA
- Opacity inside
- Color outside VA
- Opacity outside
- Silhouette
- Silhouette style
- Step outline
- Outline color
- Outline width
- Volume highlights
- Enable highlights
- Peak window
- Highlight color
- POC
- Show
- Color
- Thickness
- Dash
- Extension
- Value Area
- VA %
- Level text
- Level labels
- Labels on left
- Label at VP end
- Font size
- Delta
- Label delta
- Side
- Left
- Right
- Delta aggregation
- Heat filter
- Buy heat
- Sell heat
- Buy (no heat)
- Sell (no heat)
- Max delta width
- Opacity
- Label value
- Value position
- Side
- Overlaid
- Delta by time
- Time window (min)
- Volume Profile
- Delta
How to add it in EliteXCharts
- Open a chart and click the Indicators icon in the chart header.
- Pick the Flow category and choose Volume Profile / Delta.
- Click Add. Double-click the indicator (or use its gear) to open the settings.
- Or ask the AI Assistant: "add the Volume Profile / Delta".
Frequently asked questions
What does the Volume Profile / Delta indicator do?
The Volume Profile tool as an INDICATOR, anchored to the session. ALL of the tool's features: histogram, POC/VAH/VAL, silhouette, volume highlights (peaks), full DELTA and level text. PERIOD: full session (18:00→17:00) · RTH only (9:30–16:00) · ETH only (overnight). Up to 30 days of profiles (one per session); re-anchors on every candle and at day rollover.
How do you read the Volume Profile / Delta?
Volume Profile and Delta tabs with every tool setting + width as % of the session (zoomed out).
How do I add the Volume Profile / Delta to a chart in EliteXCharts?
Open a chart and click the Indicators icon in the chart header. Pick the Flow category and choose Volume Profile / Delta. Click Add. Double-click the indicator (or use its gear) to open the settings. Or ask the AI Assistant: "add the Volume Profile / Delta".
Related indicators
Big Trades
Marks the LARGE trades on the chart (ATAS-style sweep).
real screenshotAbsorption
Absorption: aggression that does NOT move price — Big Trades' sibling, but for whoever is HOLDING.
real screenshotTrend Pressure
Trend line driven by PRESSURE (EMA base + pressure×ATR) with signals.
real screenshotRSI Levels
Support/resistance created by RSI CROSSES.
real screenshotTry it on your own chart
Every feature on every plan — 6 months, 1 year or lifetime.
See plans & pricing