Review & training · 2:34
Trading Journal
Learn to read your whole trading history at a glance with the Trading Journal in EliteXCharts, in under 3 minutes.
Chapters
Step by step
- Open the Trading Journal from the + next to the workspace tabs, and expand it to the whole screen
- Pick the account, grouped by login with the one in a trade first, and the period you want to review
- Read the account at a glance: balance, net result, withdrawals, trades, win rate, profit factor and goal
- Use the Profit Calendar: each day's net result, % of capital and trades, the week total, and today's trade live
- Click a day to see its trades, with the pencil to annotate and the play button to replay each one
- Follow the session P&L swing, rebuilt from the ticks with the open position and the day's high and low
- Check your win rate against the breakeven your payoff needs, plus profit factor, drawdown, Kelly and more
- Record a prop firm withdrawal and set the goal with the consistency rule: progress, what's left and today's max
What the narrator says
0:08Welcome to EliteXCharts. In this video: the Trading Journal, where every trade you take lands on its own, ready to review.
0:16Open it from the plus next to the workspace tabs: Trading Journal. It opens over your chart, and the expand button gives it the whole screen.
0:24Pick the account at the top. They're grouped by login, with each type marked, and an account in a trade comes first, with its open P&L. Then the period: all, today, this week, this month, or your own dates.
Read the full transcript
0:38Across the top: your balance, net result, withdrawals, number of trades, win rate, profit factor, and your account goal.
0:47The Profit Calendar shows every day: the net result, its percentage of your capital, and the number of trades, with each week adding up on the right. Today's open trade already counts, live, and the arrows take you through the months.
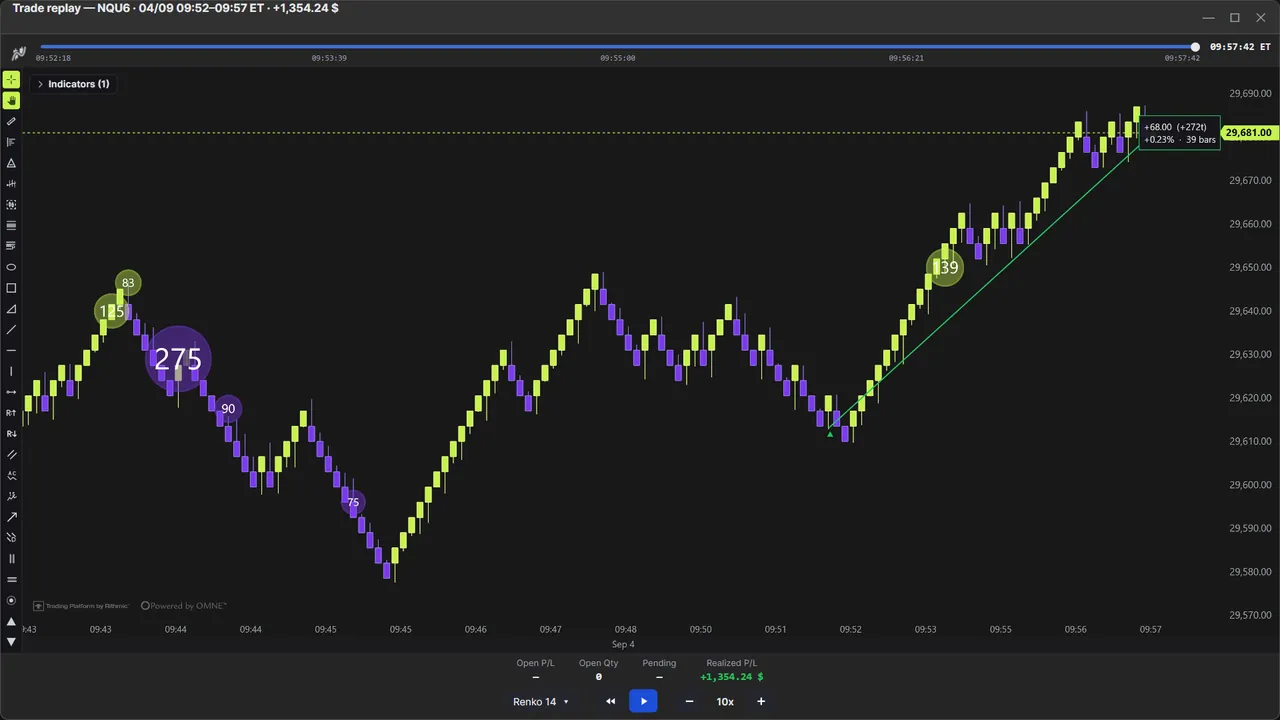
1:01Click a day to see its trades: time, side, size and result. The pencil annotates a trade, and the play button replays it, tick by tick.
1:11Under the calendar, the session P&L swing: today's curve, rebuilt from the ticks, including the open position as the market moves. Above it: where you are now, the high, the low, and how much you gave back from the high.
1:27On the right, the statistics. Your win rate comes with the breakeven your payoff needs, because a win rate alone means nothing. Then profit factor, expectancy, drawdown, Kelly, streaks, long versus short, and your best and worst hours.
1:42When your prop firm pays you, the balance drops with no trade to explain it, so the Journal asks: was it a withdrawal? Record it, and the day is marked on the calendar, and your goal starts a new cycle on the next session.
1:55Then set the goal for your next payout: the profit target, and your firm's consistency rule, if it has one. The ring shows your progress, what's left, and the most you can still make today without breaking the rule.
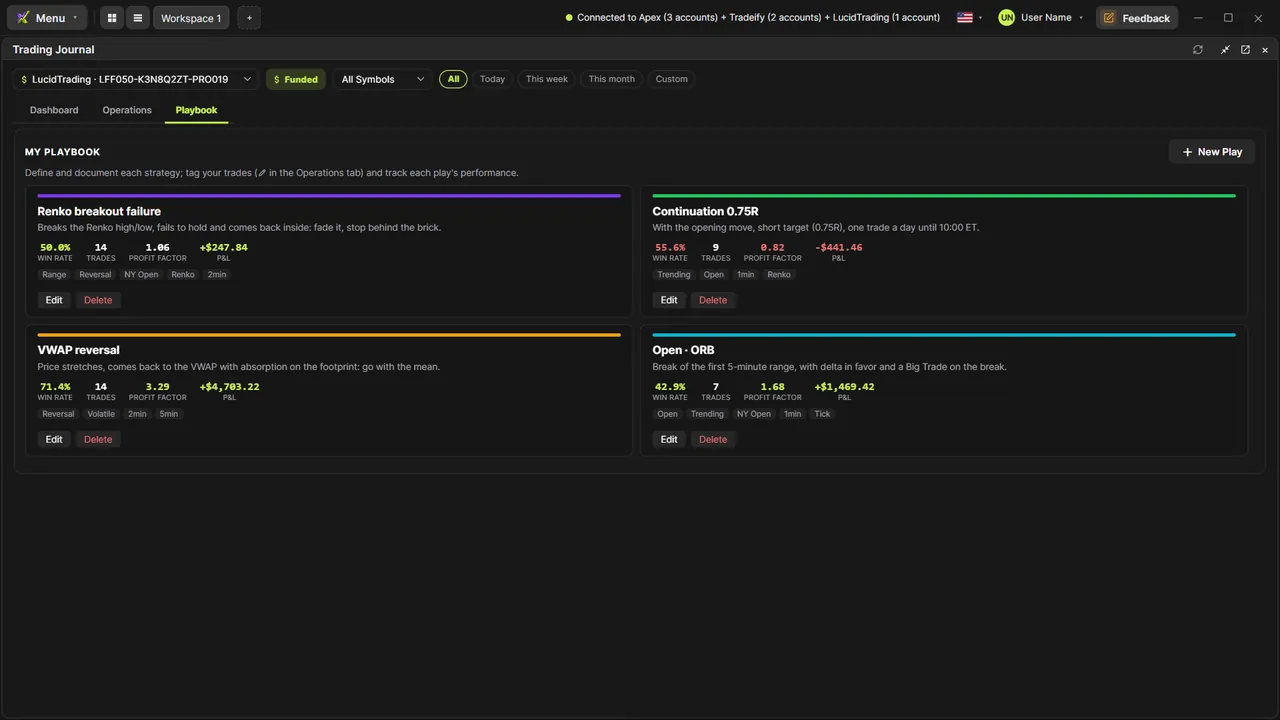
2:07Further down, each chart answers one question in its first line: your cumulative result and drawdown, results by hour and by weekday, long versus short, your setups, and what each mistake cost. Configure charts picks the ones you see.
2:24That's the Trading Journal in EliteXCharts: every trade on its own, the numbers that matter, and your prop firm rules in plain sight.