
Flow
OBV (On-Balance Volume)
On-Balance Volume in its own panel.
Real example in the platform
OBV (On-Balance Volume) on the NQ, 1-minute candles built from real ticks (October 16, 2026, Rithmic feed) — a screenshot of the platform itself, factory settings.
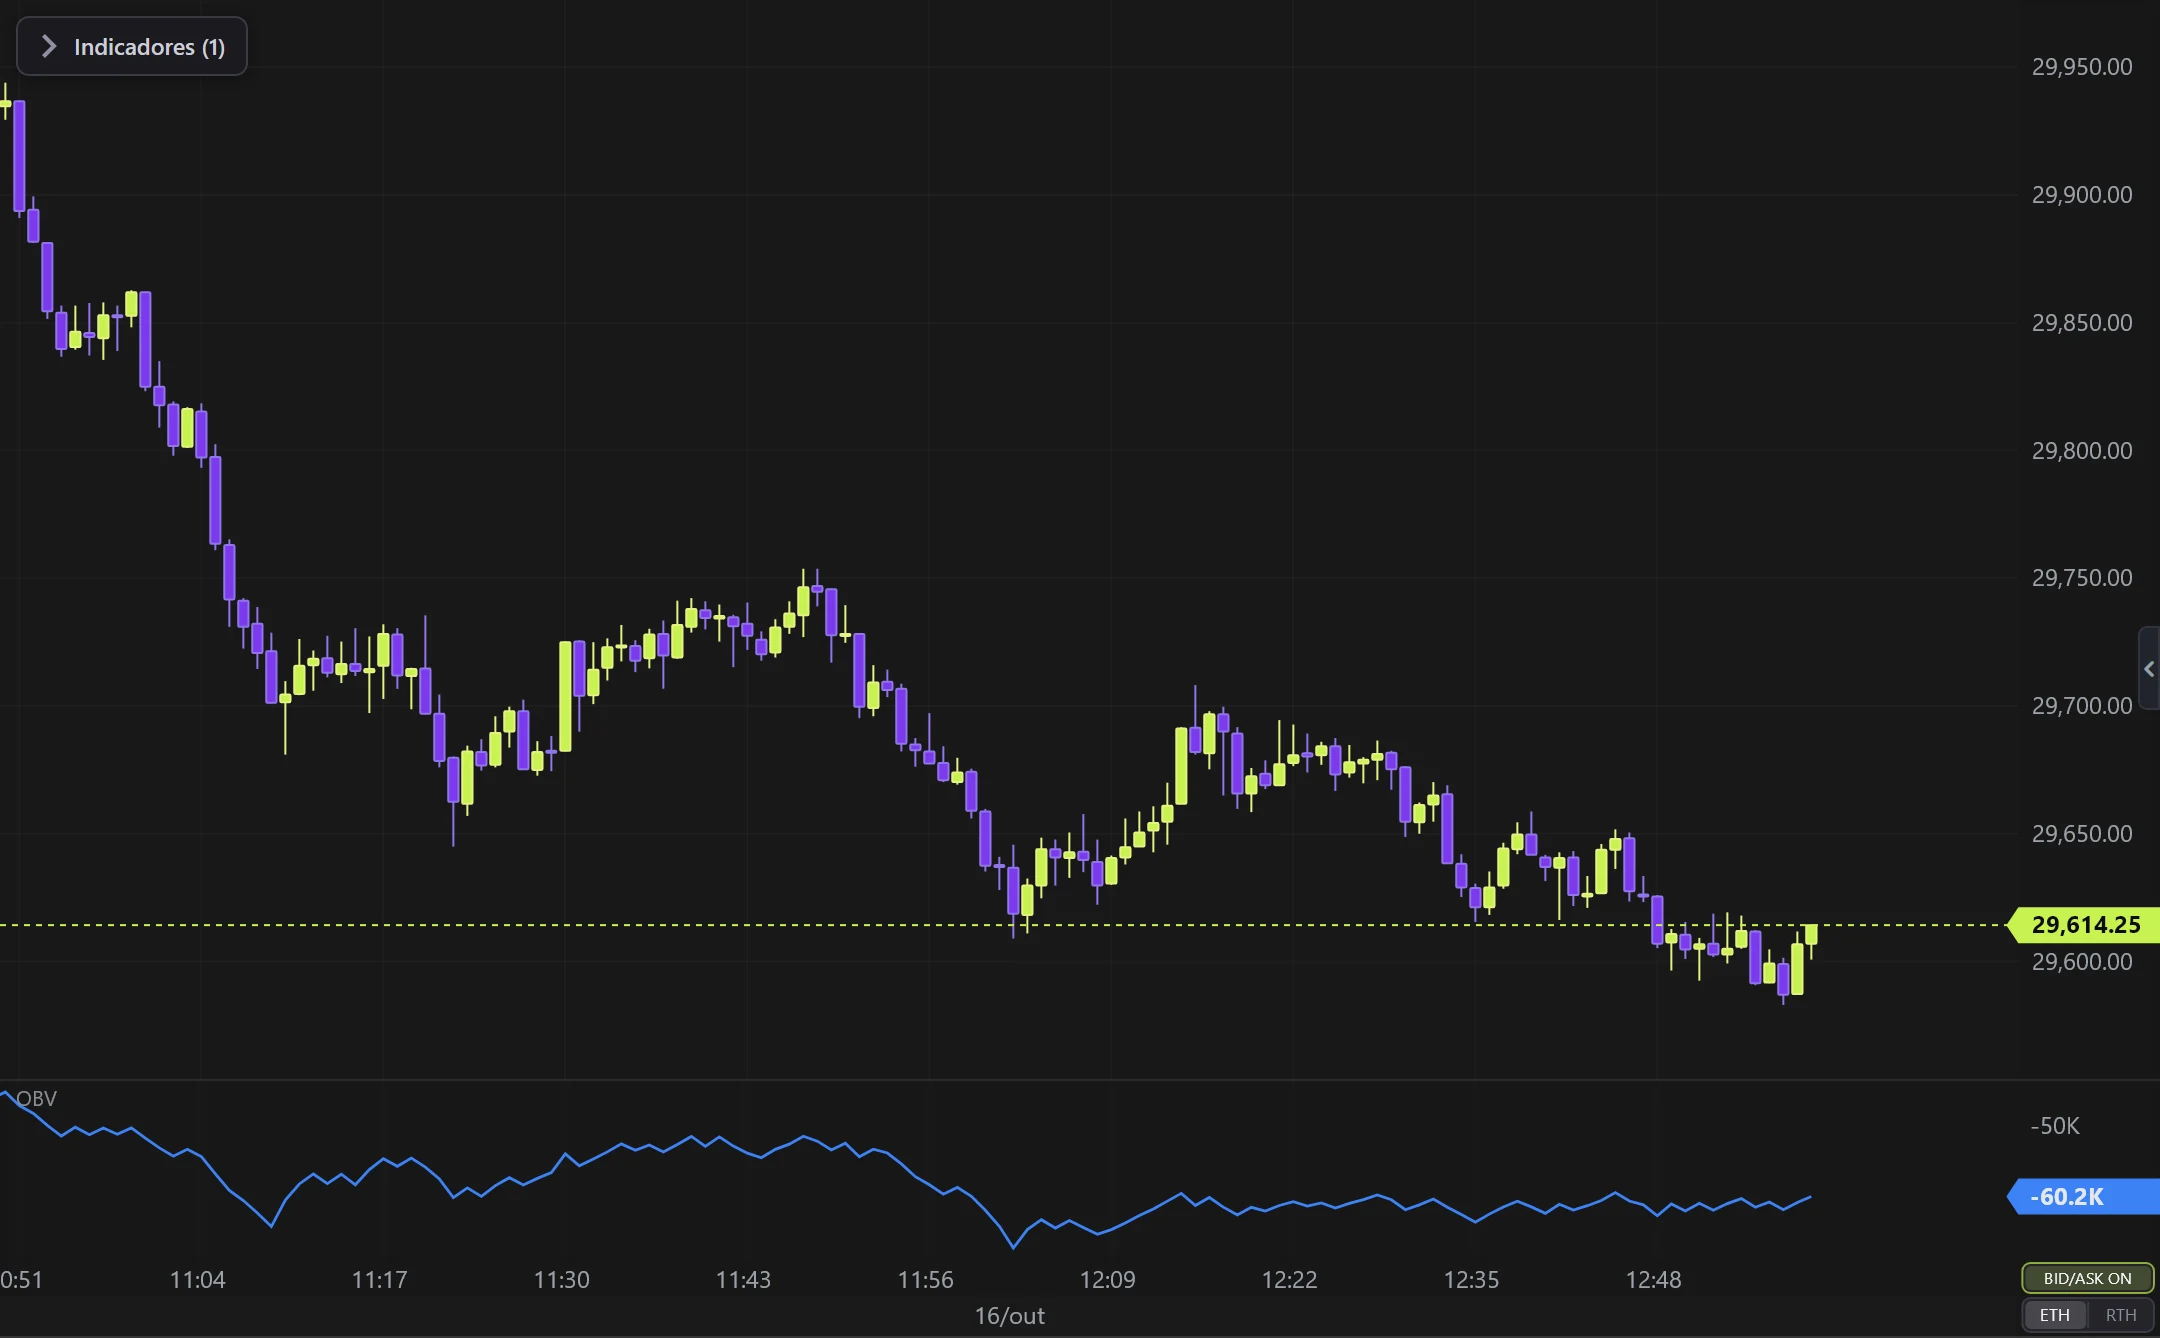
What it does
- Running volume sum: + on up closes, − on down closes.
- OBV/price divergence anticipates reversals.
Options
- Optional moving average, colors.
Settings
Everything you can change in the indicator's settings dialog, in the same order as in the platform:
- Color
- Pane height (px)
- Background blur
- Moving average
- Show
- Period
How to add it in EliteXCharts
- Open a chart and click the Indicators icon in the chart header.
- Pick the Flow category and choose OBV (On-Balance Volume).
- Click Add. Double-click the indicator (or use its gear) to open the settings.
- Or ask the AI Assistant: "add the OBV (On-Balance Volume)".
Frequently asked questions
What does the OBV (On-Balance Volume) indicator do?
On-Balance Volume in its own panel. Running volume sum: + on up closes, − on down closes. OBV/price divergence anticipates reversals.
How do you read the OBV (On-Balance Volume)?
Optional moving average, colors.
How do I add the OBV (On-Balance Volume) to a chart in EliteXCharts?
Open a chart and click the Indicators icon in the chart header. Pick the Flow category and choose OBV (On-Balance Volume). Click Add. Double-click the indicator (or use its gear) to open the settings. Or ask the AI Assistant: "add the OBV (On-Balance Volume)".
Related indicators
Big Trades
Marks the LARGE trades on the chart (ATAS-style sweep).
real screenshotAbsorption
Absorption: aggression that does NOT move price — Big Trades' sibling, but for whoever is HOLDING.
real screenshotTrend Pressure
Trend line driven by PRESSURE (EMA base + pressure×ATR) with signals.
real screenshotRSI Levels
Support/resistance created by RSI CROSSES.
real screenshotTry it on your own chart
Every feature on every plan — 6 months, 1 year or lifetime.
See plans & pricing