Execution · 2:22
Your account on the chart
Learn to put your prop firm account on the chart in EliteXCharts, as balances and as lines, in under 3 minutes.
Chapters
Step by step
- Find Account today right below your balance: how much is left to today's goal, and how much is still available today
- See how today's goal comes from your account's goal and consistency rule: here, a balance of 60,027
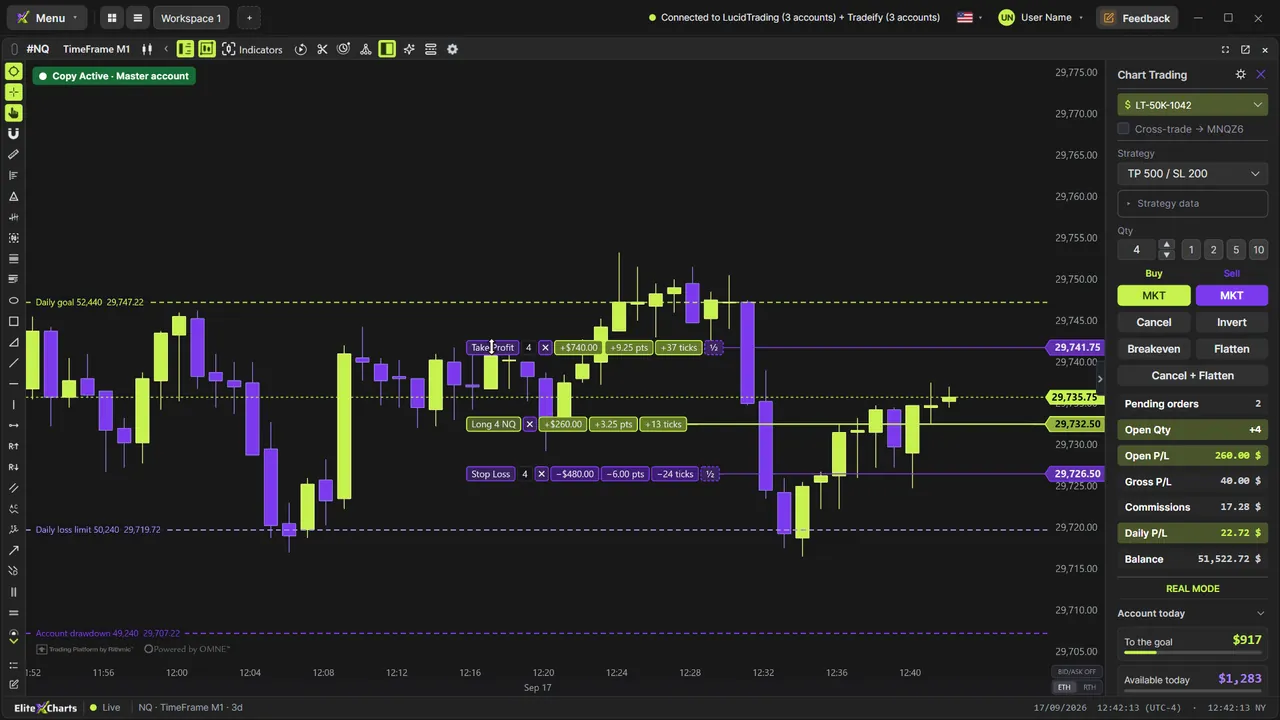
- Check the day breakeven, where the day started, and the daily loss limit, the most you can lose today
- Lower the daily loss limit for today only with the pencil, and it goes back by itself tomorrow
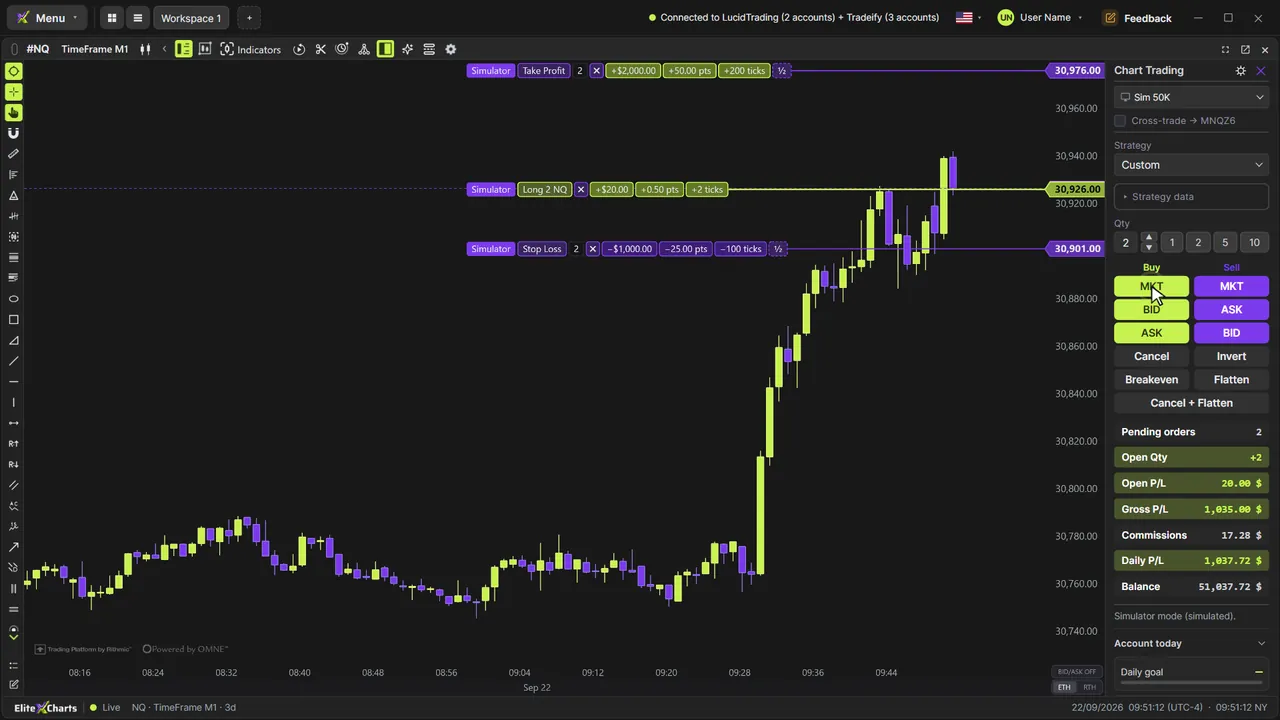
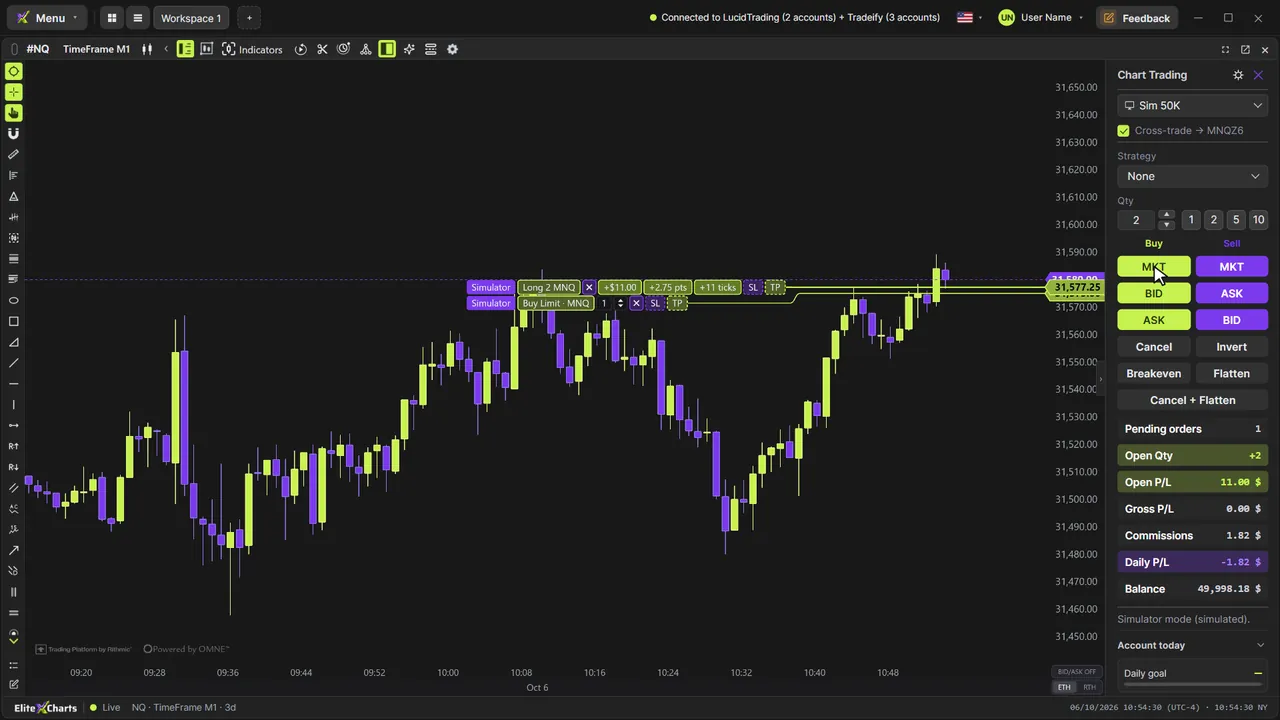
- Buy 10 contracts and watch each balance become a line at the price where the trade takes your account there
- Find the account drawdown way down: the floor that blows the account, here fixed at 48,000
- Show or hide each line with its eye; the day breakeven sits right at your entry
- Watch the goal bar fill and say hit as the price climbs, then close the trade and see the account marked approved
What the narrator says
0:08Welcome to EliteXCharts. In this video, you'll put your account on the chart: the daily goal, the day breakeven, the daily loss limit, and the account drawdown.
0:18Right below your balance in the Chart Trading panel, you'll find Account today. Scroll down: on top, how much is left to today's goal, and how much is still available today.
0:30Below that, one line per item: the daily goal, the daily limit, the account drawdown, and the breakevens. The goal and the limit show the amount, and the balance where it sits.
Read the full transcript
0:43The daily goal comes from your account: its goal and its consistency rule. This evaluation is 2,223 dollars from its target, so today's goal is a balance of 60,027.
0:56The day breakeven is where the day started. The daily loss limit is the most you can lose today: here, 1,000 dollars, at 56,804.
1:07Want to risk less today? Click the pencil, type 800, and press Enter. It's for today only: the account keeps its 1,000, and tomorrow the limit goes back by itself.
1:18Now buy 10 contracts. With a position, each balance becomes a line, at the price where this trade takes your account there: the goal 11 points up, and the loss limit 4 points down.
1:32And way down, the account drawdown: the floor that blows the account. Here it's fixed at 48,000, 2,000 below the starting balance, and it can't be changed from this panel.
1:46Each eye shows or hides its line, and the day breakeven sits right at your entry, where today's result is back to zero.
1:56As the price climbs, the goal bar fills up. At 60,027, it says hit: today's goal is in.
2:05Close the trade, and since that was all the evaluation had left, the account is marked approved.
2:12That's your account on the chart in EliteXCharts: the goal, the breakeven, the loss limit, and the drawdown, always in sight.