
Structure
Market Structure (BOS/CHoCH)
Pivot-based market structure (SMC/ICT).
Real example in the platform
Market Structure (BOS/CHoCH) on the NQ, 1-minute candles built from real ticks (October 16, 2026, Rithmic feed) — a screenshot of the platform itself, factory settings.
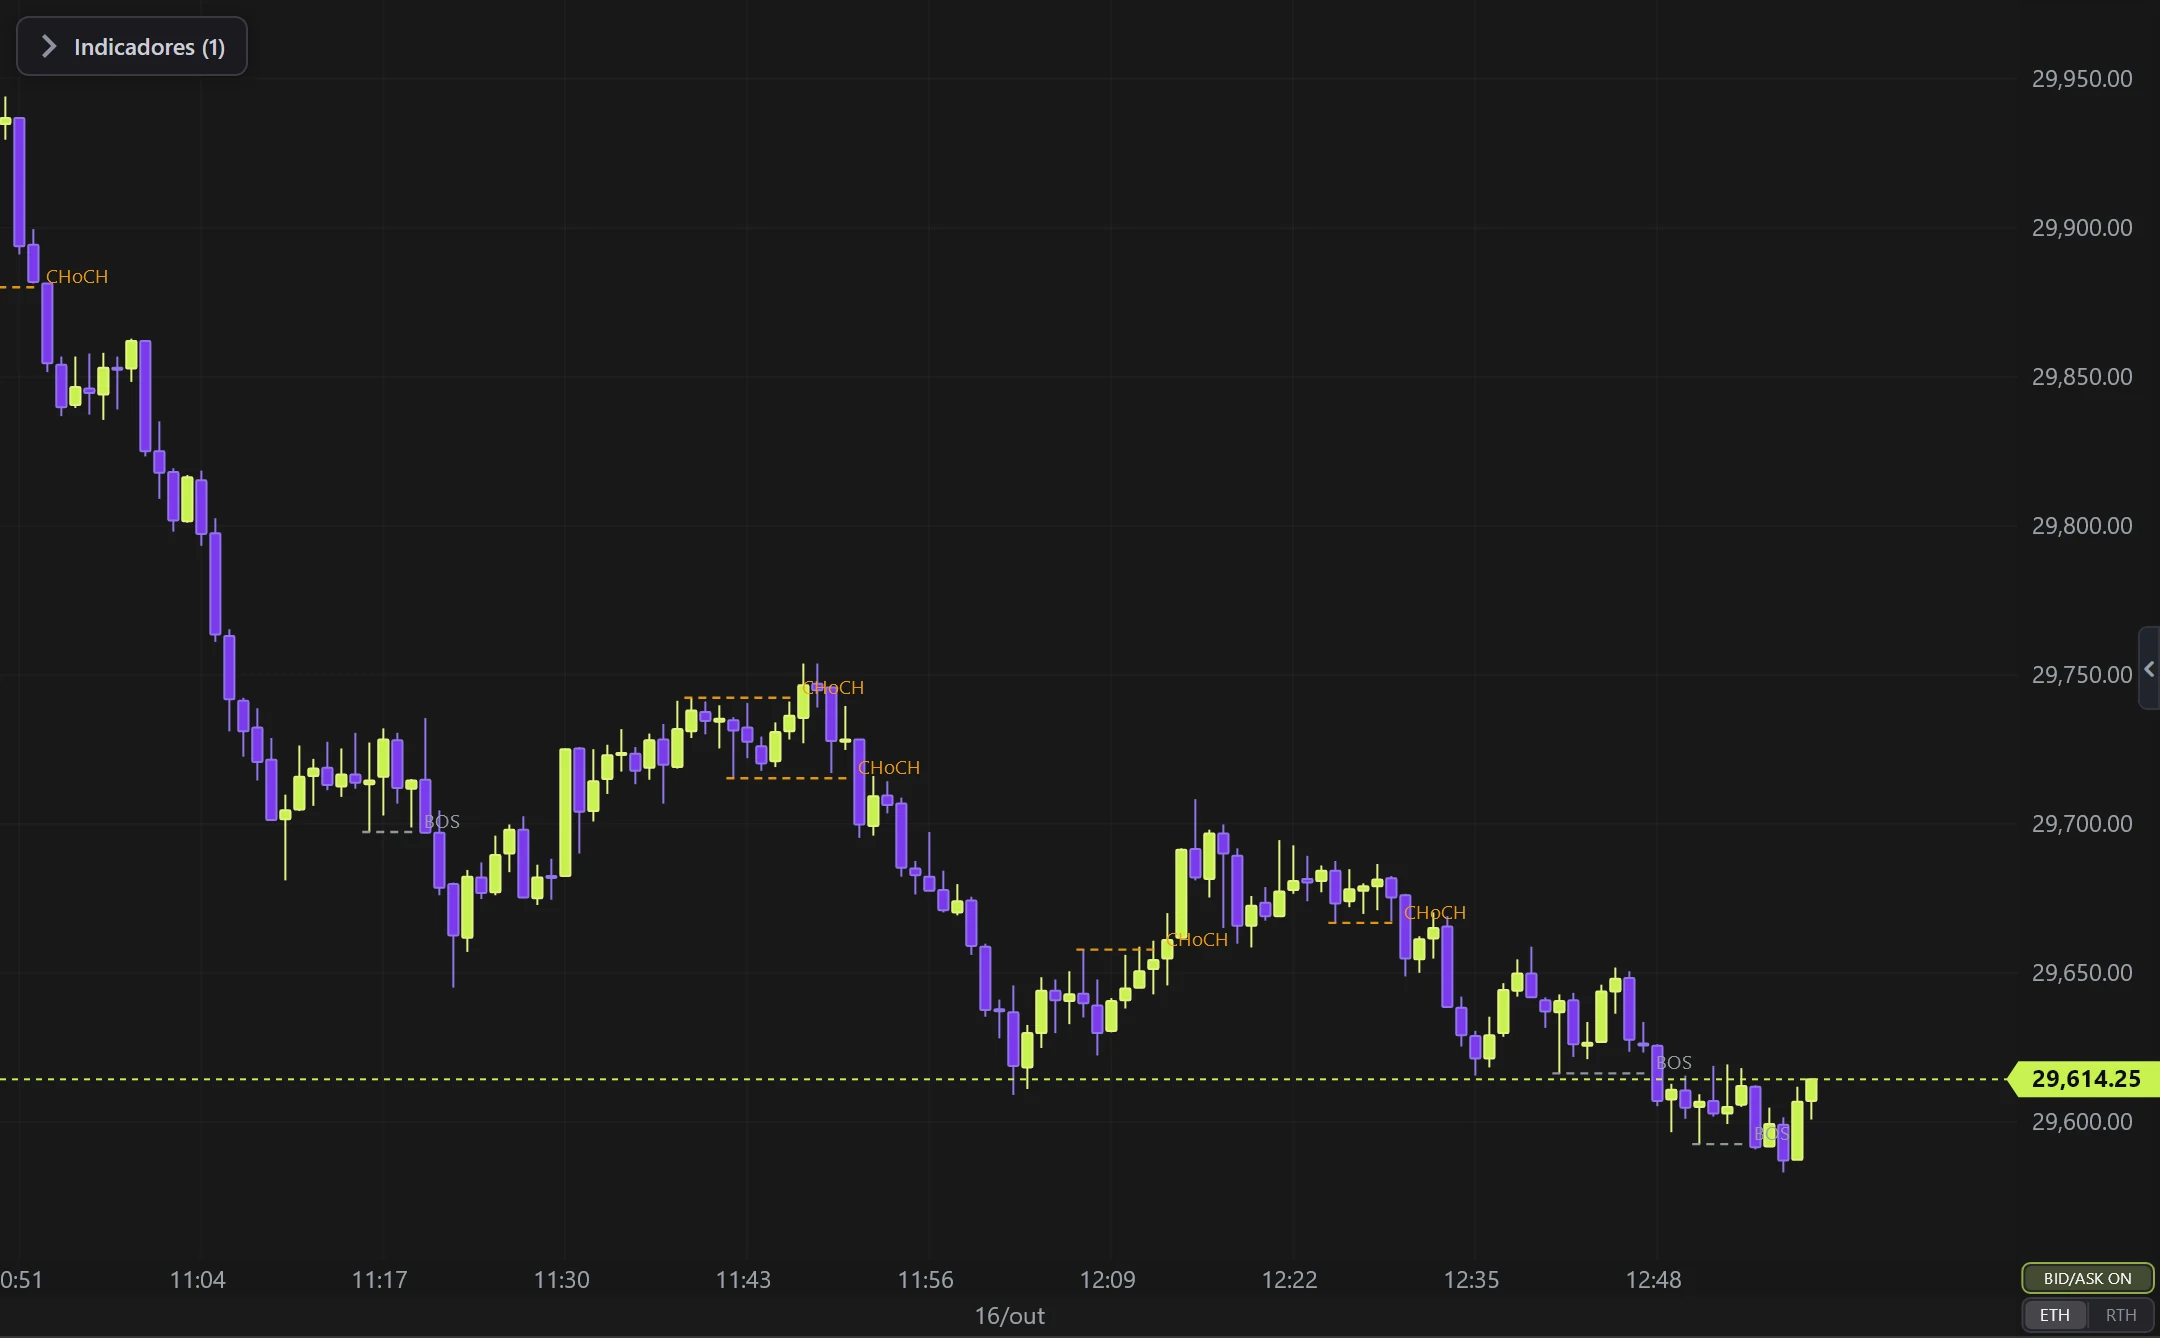
What it does
- Detects swing highs/lows (fractals) and marks when price BREAKS one.
- BOS (Break of Structure) = break with the trend; CHoCH (Change of Character) = break against it (possible reversal).
- Dashed line at the broken level + label.
Options
- Pivot sensitivity, BOS/CHoCH colors, show each.
Settings
Everything you can change in the indicator's settings dialog, in the same order as in the platform:
- Pivot sensitivity (bars)
- Show BOS
- Show CHoCH
- Thickness
- Colors
- BOS
- CHoCH
How to add it in EliteXCharts
- Open a chart and click the Indicators icon in the chart header.
- Pick the Structure category and choose Market Structure (BOS/CHoCH).
- Click Add. Double-click the indicator (or use its gear) to open the settings.
- Or ask the AI Assistant: "add the Market Structure (BOS/CHoCH)".
Frequently asked questions
What does the Market Structure (BOS/CHoCH) indicator do?
Pivot-based market structure (SMC/ICT). Detects swing highs/lows (fractals) and marks when price BREAKS one. BOS (Break of Structure) = break with the trend; CHoCH (Change of Character) = break against it (possible reversal). Dashed line at the broken level + label.
How do you read the Market Structure (BOS/CHoCH)?
Pivot sensitivity, BOS/CHoCH colors, show each.
How do I add the Market Structure (BOS/CHoCH) to a chart in EliteXCharts?
Open a chart and click the Indicators icon in the chart header. Pick the Structure category and choose Market Structure (BOS/CHoCH). Click Add. Double-click the indicator (or use its gear) to open the settings. Or ask the AI Assistant: "add the Market Structure (BOS/CHoCH)".
Related indicators
Swing Highs & Lows
Marks the structural PIVOTS (swing highs and lows) on Renko.
real screenshotHigher Timeframes (right)
Candles of HIGHER timeframes in a strip on the right side.
real screenshotAMD Cycle
Accumulation → Manipulation → Distribution cycle over the HIGHER timeframe candle.
real screenshotHTF Power of Three
The candles of a HIGHER timeframe on the right of the chart, the last one forming live: ICT's Power of Three…
real screenshotTry it on your own chart
Every feature on every plan — 6 months, 1 year or lifetime.
See plans & pricing