
Structure
Higher Timeframe Frame
The candle of a HIGHER timeframe drawn around the candles of your chart, like the candle frame in the footprint.
Real example in the platform
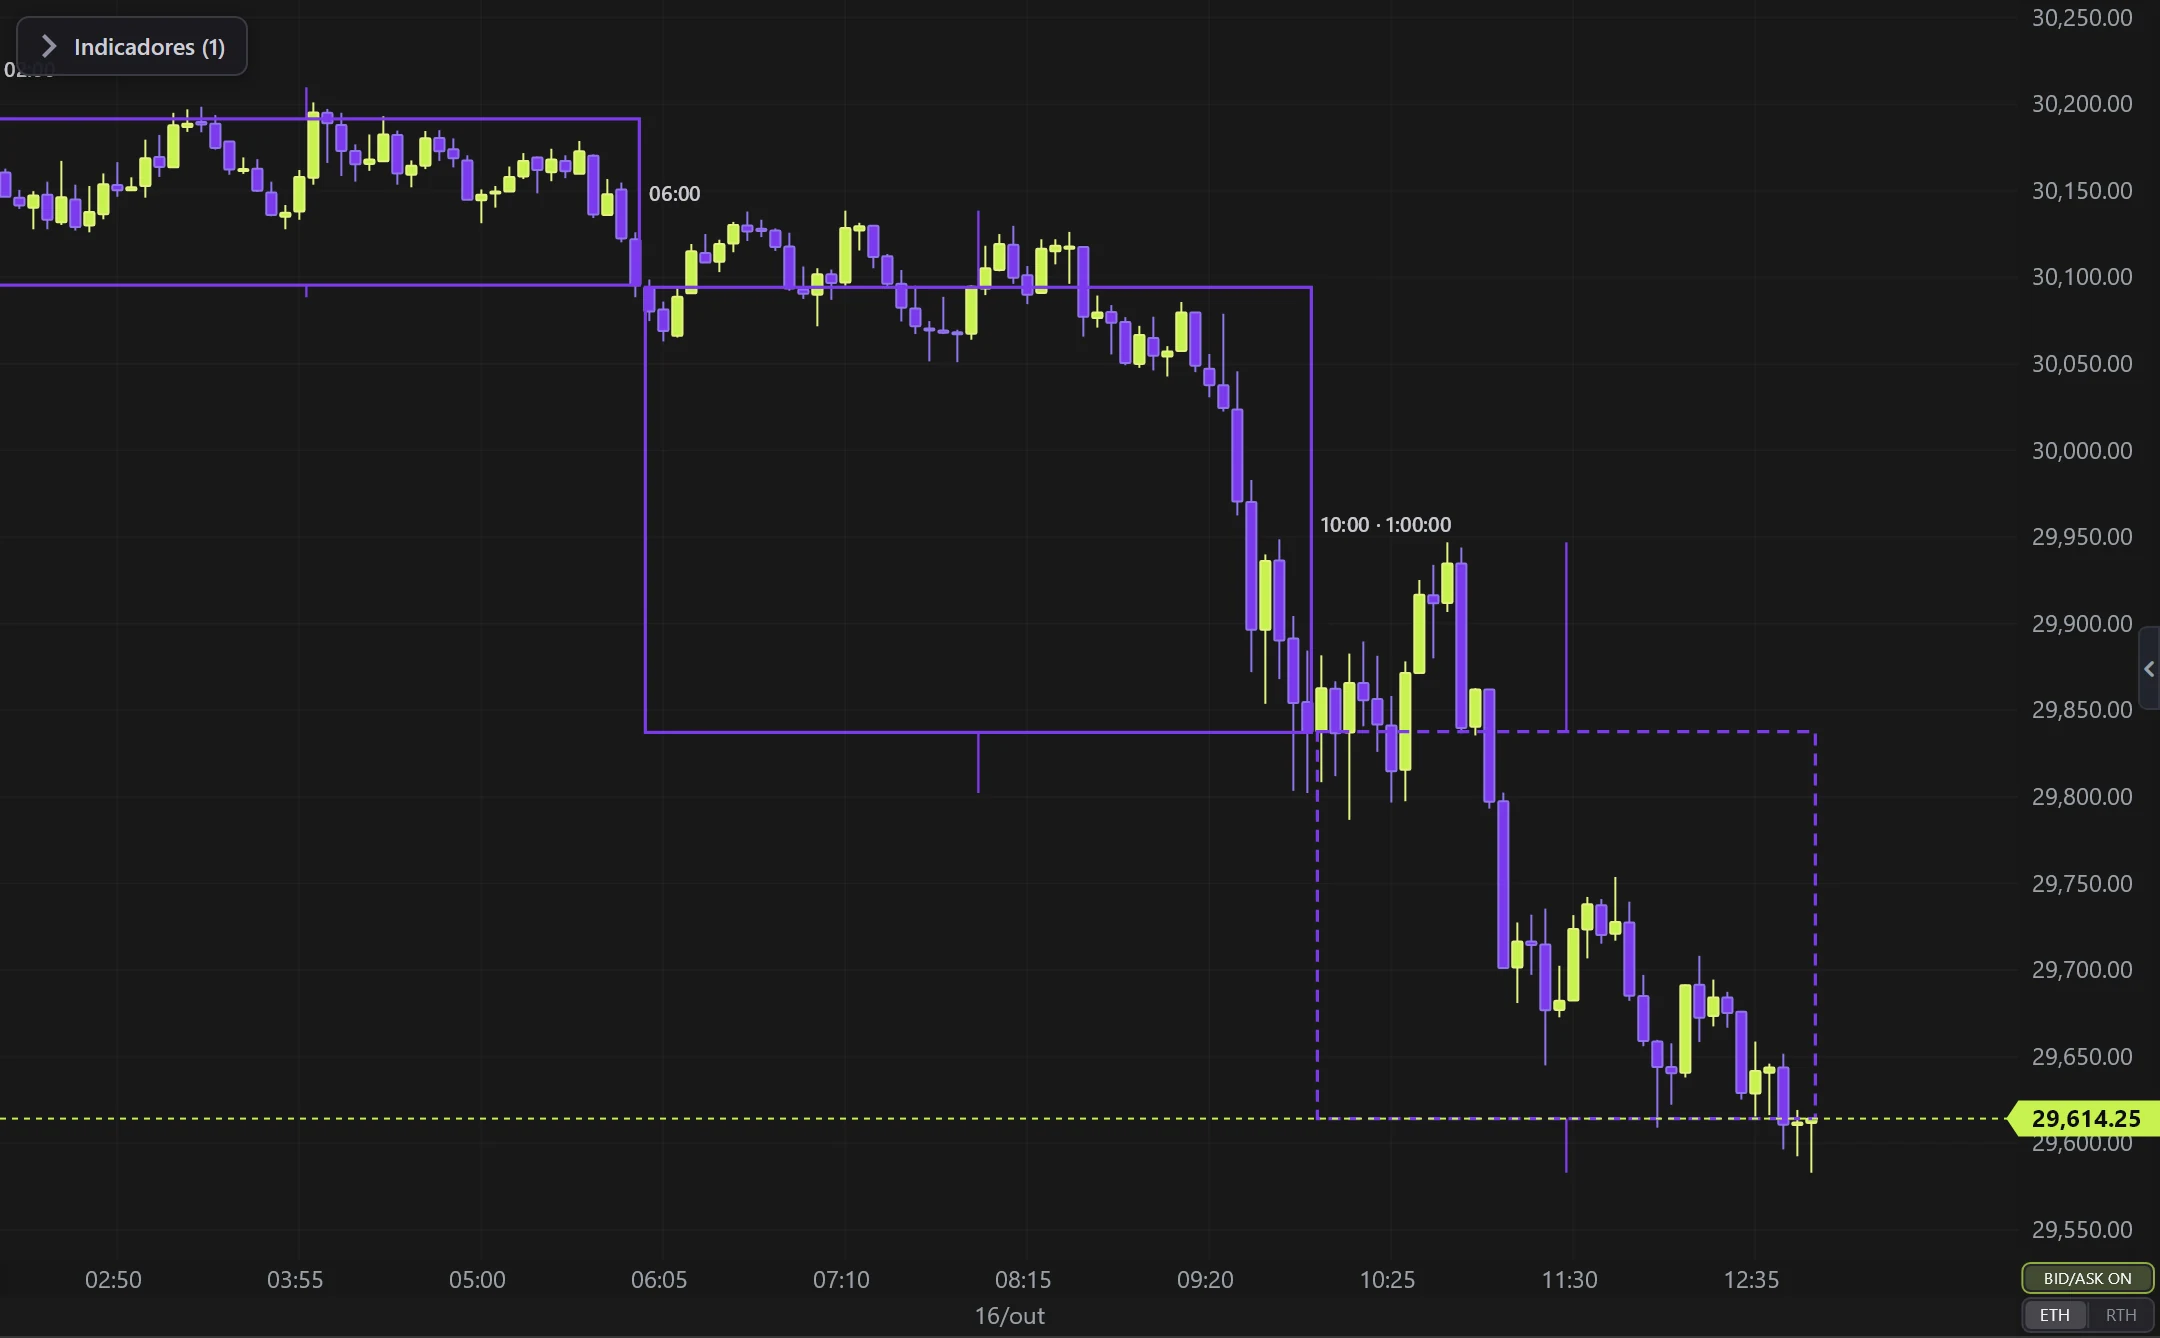
Higher Timeframe Frame on the NQ, 5-minute candles built from real ticks (October 16, 2026, Rithmic feed) — a screenshot of the platform itself, factory settings.
What it does
- Draws the higher-timeframe candle (by default, the last 3 four-hour candles) AROUND the bars of the chart that happened inside it: the rectangle goes from the open to the close, with the wick to the high and the low.
- The frame still forming is dashed and shows its time and how long until it closes.
- Works on any chart (time, Renko, Range, Tick): the higher candles are built from the ticks.
Options
- Frame timeframe (1m to 4h, Daily, Weekly) or the higher candle in Renko, Range or Tick; how many frames (1 to 20).
- A second frame inside (e.g. the 1h inside the 4h), thinner and with a lighter fill.
- Body: outline only, outline and fill, or fill only; candle direction color (up and down) or one color per timeframe; fill color and transparency.
- Wick from the center, the left, the right, a dashed box or no wick.
- Time, countdown, dashed forming frame, outline over or behind the candles, width and colors.
How to read
- Outline in the up color: the higher candle is above its open; in the down color, below. Inside it you see where price made the high and the low — the Power of Three reading without taking your eyes off the bars.
Settings
Everything you can change in the indicator's settings dialog, in the same order as in the platform:
- Daily
- Weekly
- Off
- Time
- Higher candle type
- Brick size (ticks)
- Bar range (ticks)
- Ticks per bar
- Frame timeframe
- How many frames
- Frame
- Second frame
- Second timeframe
- How many of the second
- Body and fill
- Body
- Outline
- Outline and fill
- Fill only
- Frame color
- Candle direction (up and down)
- One per timeframe
- Fill in the frame color
- Fill color
- Fill transparency
- Wick
- Wick
- From the center
- From the left
- From the right
- Dashed box
- No wick
- Labels
- Time of each frame
- Countdown to close
- Forming frame dashed
- Visual
- Outline over the candles
- Outline width
- Colors
- Use chart colors
- Up
- Down
- Label color
How to add it in EliteXCharts
- Open a chart and click the Indicators icon in the chart header.
- Pick the Structure category and choose Higher Timeframe Frame.
- Click Add. Double-click the indicator (or use its gear) to open the settings.
- Or ask the AI Assistant: "add the Higher Timeframe Frame".
Frequently asked questions
What does the Higher Timeframe Frame indicator do?
The candle of a HIGHER timeframe drawn around the candles of your chart, like the candle frame in the footprint. Draws the higher-timeframe candle (by default, the last 3 four-hour candles) AROUND the bars of the chart that happened inside it: the rectangle goes from the open to the close, with the wick to the high and the low. The frame still forming is dashed and shows its time and how long until it closes. Works on any chart (time, Renko, Range, Tick): the higher candles are built from the ticks.
How do you read the Higher Timeframe Frame?
Outline in the up color: the higher candle is above its open; in the down color, below. Inside it you see where price made the high and the low — the Power of Three reading without taking your eyes off the bars.
How do I add the Higher Timeframe Frame to a chart in EliteXCharts?
Open a chart and click the Indicators icon in the chart header. Pick the Structure category and choose Higher Timeframe Frame. Click Add. Double-click the indicator (or use its gear) to open the settings. Or ask the AI Assistant: "add the Higher Timeframe Frame".
Related indicators
Swing Highs & Lows
Marks the structural PIVOTS (swing highs and lows) on Renko.
real screenshotHigher Timeframes (right)
Candles of HIGHER timeframes in a strip on the right side.
real screenshotAMD Cycle
Accumulation → Manipulation → Distribution cycle over the HIGHER timeframe candle.
real screenshotHTF Power of Three
The candles of a HIGHER timeframe on the right of the chart, the last one forming live: ICT's Power of Three…
real screenshotTry it on your own chart
Every feature on every plan — 6 months, 1 year or lifetime.
See plans & pricing