
Structure
Fair Value Gap (FVG)
Smart Money / ICT imbalances (3-candle gaps).
Real example in the platform
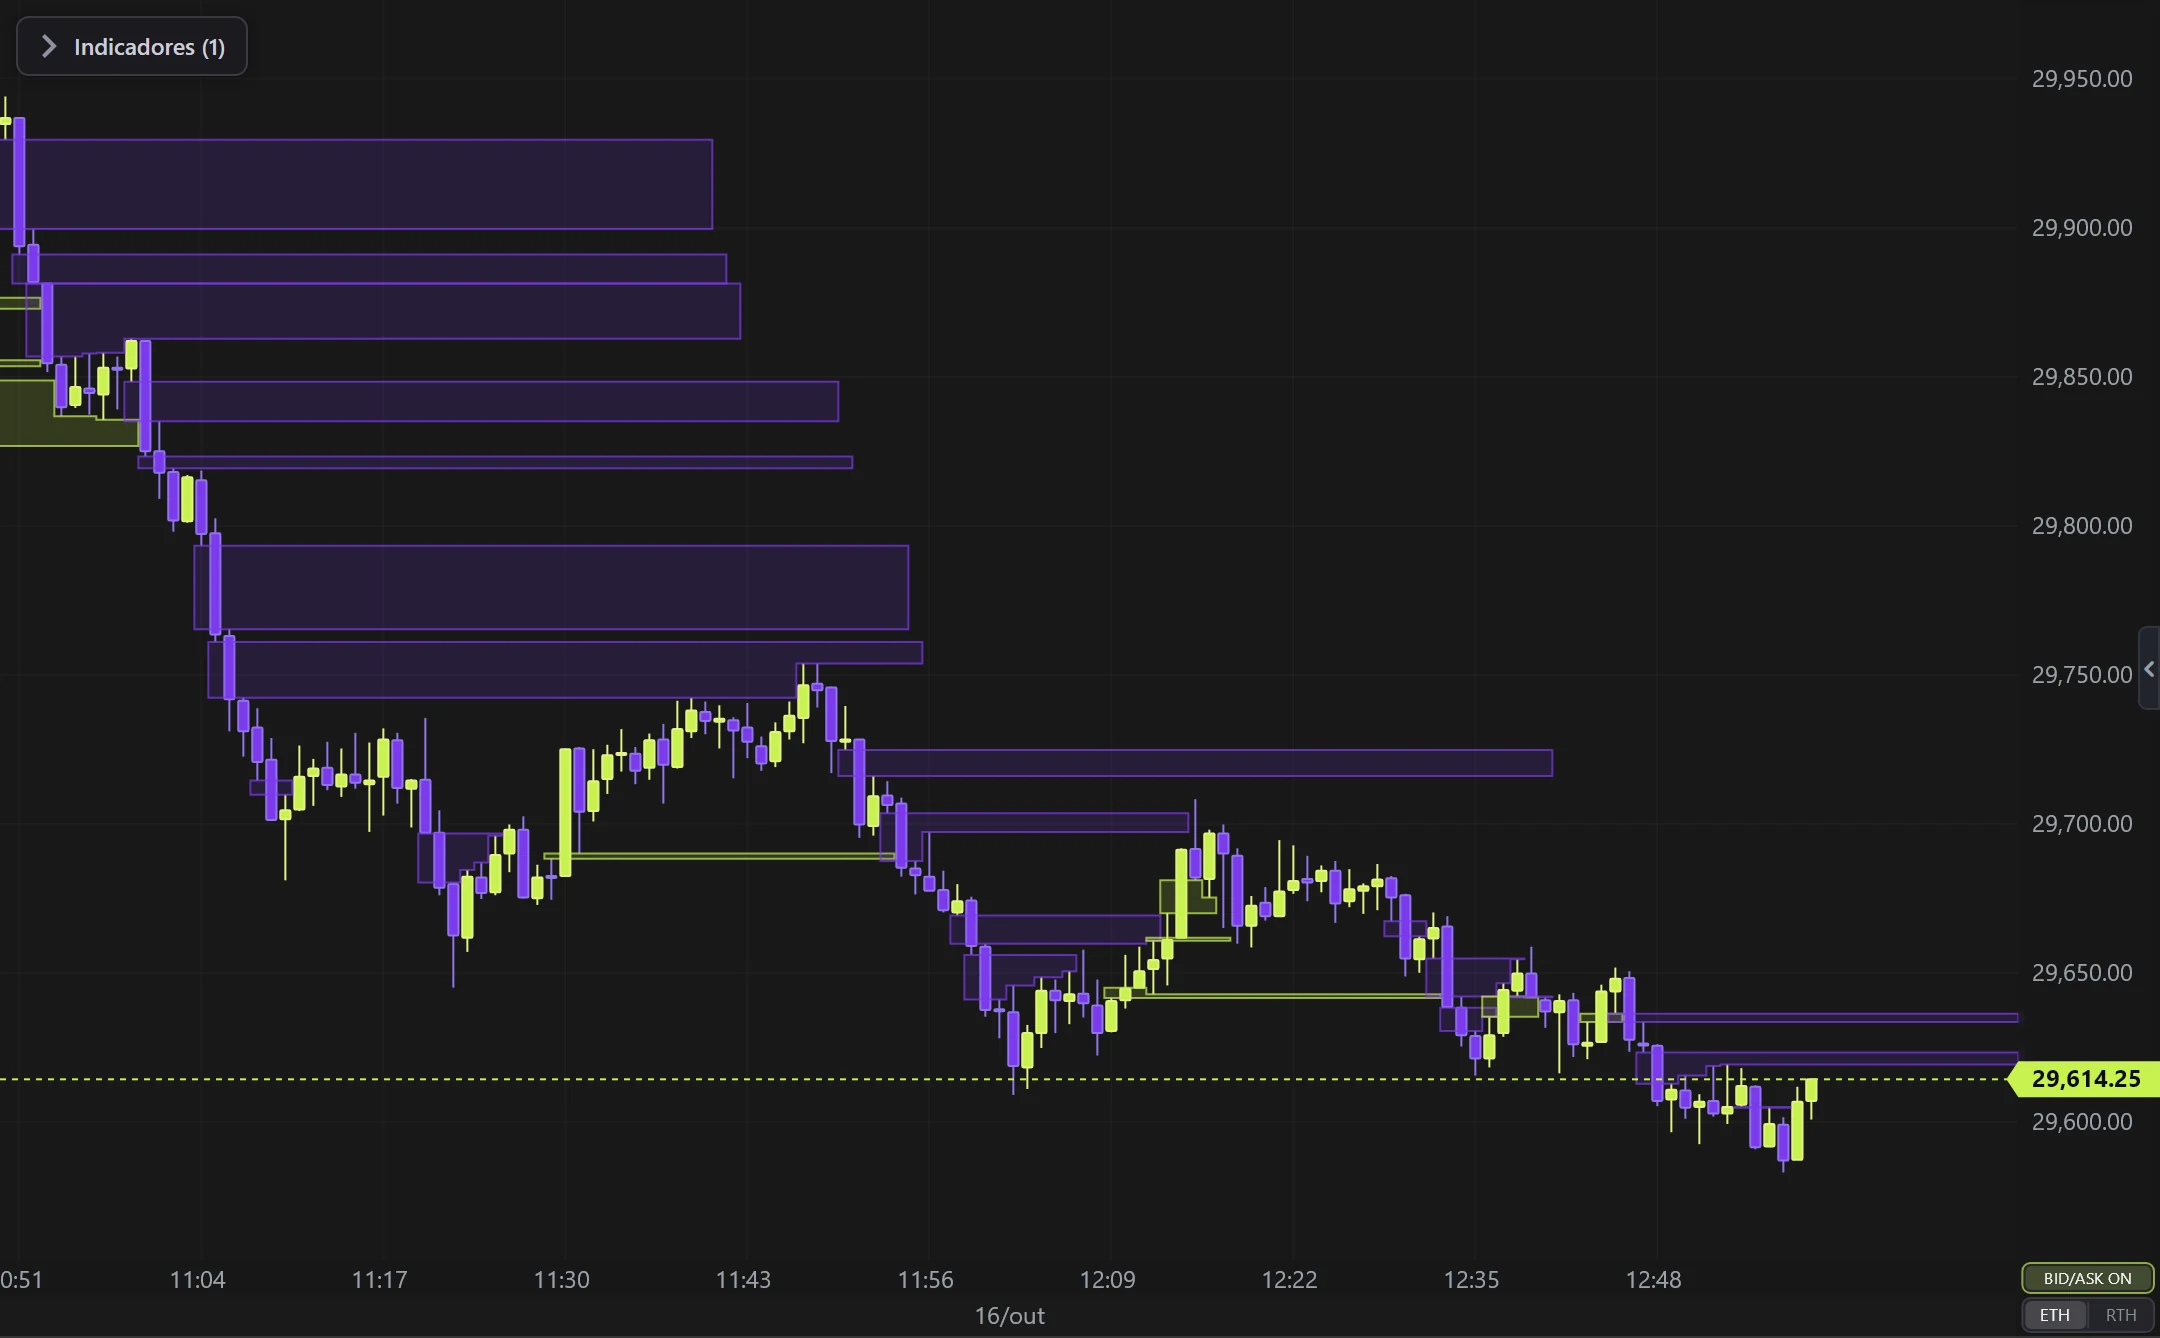
Fair Value Gap (FVG) on the NQ, 1-minute candles built from real ticks (October 16, 2026, Rithmic feed) — a screenshot of the platform itself, factory settings.
What it does
- Marks the zones where price moved too fast and left a void (the 1st and 3rd candles don't overlap).
- Green = bullish FVG (support), red = bearish (resistance). Price tends to come back and fill it.
- The box stops/disappears when the gap is mitigated (filled).
Options
- Colors, opacity, hide filled, extend to price, minimum size (ticks).
Settings
Everything you can change in the indicator's settings dialog, in the same order as in the platform:
- Hide filled
- Extend to price
- Min size (ticks)
- Validity (bars, 0 = unlimited)
- Opacity
- Colors
- Bullish FVG
- Bearish FVG
- Calculation source (another candle type/timeframe)
How to add it in EliteXCharts
- Open a chart and click the Indicators icon in the chart header.
- Pick the Structure category and choose Fair Value Gap (FVG).
- Click Add. Double-click the indicator (or use its gear) to open the settings.
- Or ask the AI Assistant: "add the Fair Value Gap (FVG)".
Frequently asked questions
What does the Fair Value Gap (FVG) indicator do?
Smart Money / ICT imbalances (3-candle gaps). Marks the zones where price moved too fast and left a void (the 1st and 3rd candles don't overlap). Green = bullish FVG (support), red = bearish (resistance). Price tends to come back and fill it. The box stops/disappears when the gap is mitigated (filled).
How do you read the Fair Value Gap (FVG)?
Colors, opacity, hide filled, extend to price, minimum size (ticks).
How do I add the Fair Value Gap (FVG) to a chart in EliteXCharts?
Open a chart and click the Indicators icon in the chart header. Pick the Structure category and choose Fair Value Gap (FVG). Click Add. Double-click the indicator (or use its gear) to open the settings. Or ask the AI Assistant: "add the Fair Value Gap (FVG)".
Related indicators
Swing Highs & Lows
Marks the structural PIVOTS (swing highs and lows) on Renko.
real screenshotHigher Timeframes (right)
Candles of HIGHER timeframes in a strip on the right side.
real screenshotAMD Cycle
Accumulation → Manipulation → Distribution cycle over the HIGHER timeframe candle.
real screenshotHTF Power of Three
The candles of a HIGHER timeframe on the right of the chart, the last one forming live: ICT's Power of Three…
real screenshotTry it on your own chart
Every feature on every plan — 6 months, 1 year or lifetime.
See plans & pricing