
Flow
Delta Histogram
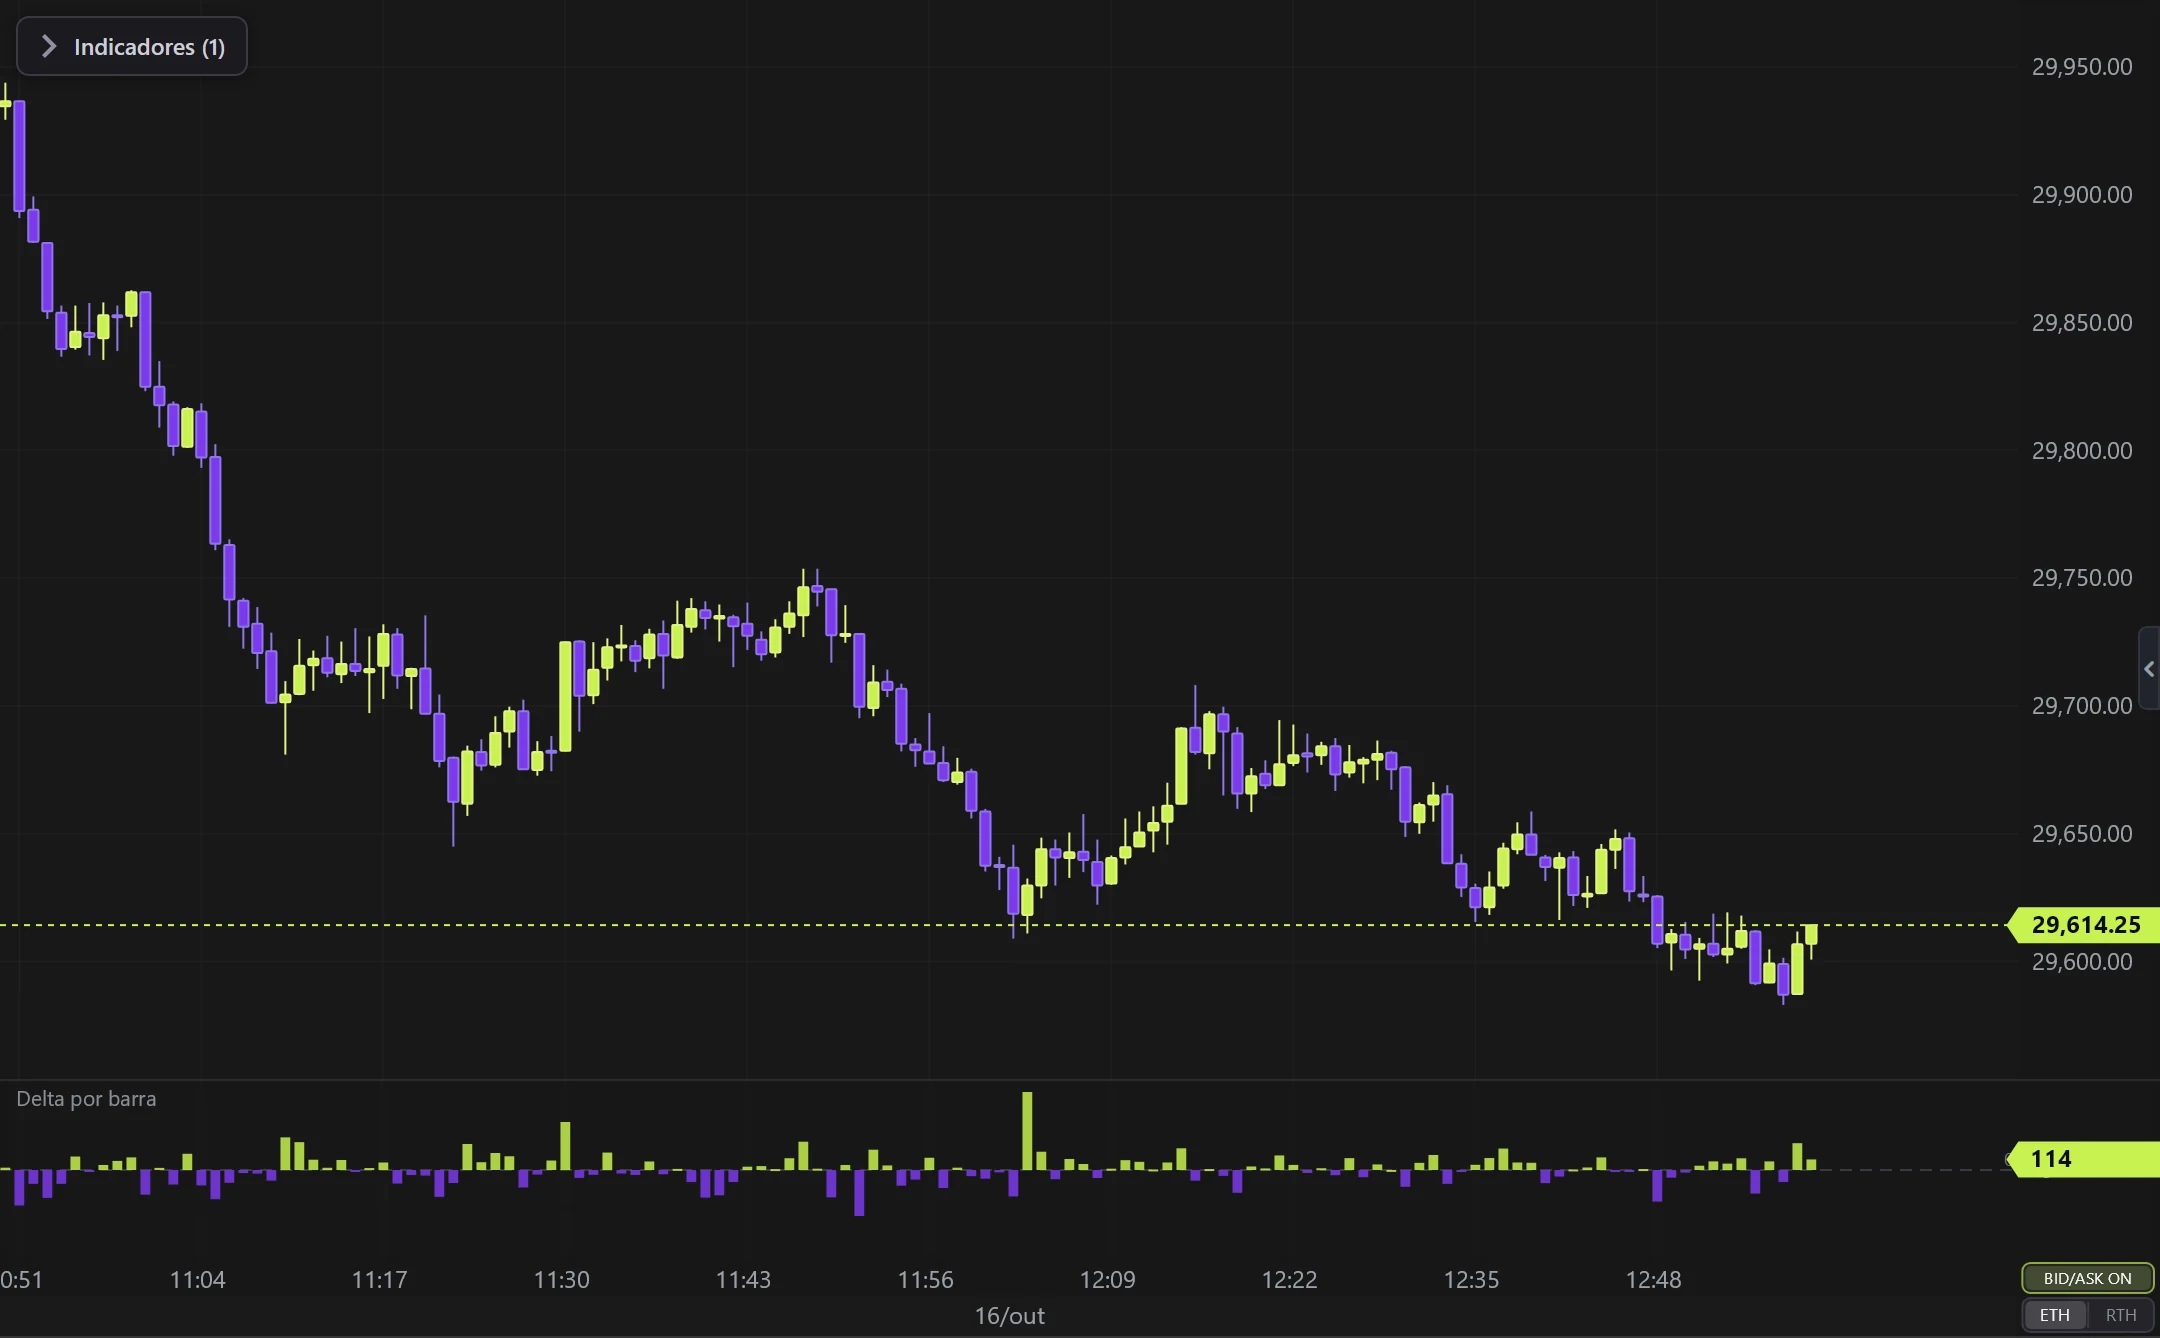
The delta of EACH BAR in its own panel, MACD style.
Real example in the platform
Delta Histogram on the NQ, 1-minute candles built from real ticks (October 16, 2026, Rithmic feed) — a screenshot of the platform itself, factory settings.
What it does
- Bar UP when aggressive buying won the candle; DOWN when selling won — the size is the imbalance strength.
- Source = the bar footprint, so the number matches the footprint cells.
- Sibling of Cumulative Delta: that one sums the whole series, this one isolates each candle.
Options
- Up/down colors, bar width, value on top, pane height.
Settings
Everything you can change in the indicator's settings dialog, in the same order as in the platform:
- Bar width
- Show value
- Pane height (px)
- Background blur
- Colors
- Up
- Down
- Paint candles
How to add it in EliteXCharts
- Open a chart and click the Indicators icon in the chart header.
- Pick the Flow category and choose Delta Histogram.
- Click Add. Double-click the indicator (or use its gear) to open the settings.
- Or ask the AI Assistant: "add the Delta Histogram".
Frequently asked questions
What does the Delta Histogram indicator do?
The delta of EACH BAR in its own panel, MACD style. Bar UP when aggressive buying won the candle; DOWN when selling won — the size is the imbalance strength. Source = the bar footprint, so the number matches the footprint cells. Sibling of Cumulative Delta: that one sums the whole series, this one isolates each candle.
How do you read the Delta Histogram?
Up/down colors, bar width, value on top, pane height.
How do I add the Delta Histogram to a chart in EliteXCharts?
Open a chart and click the Indicators icon in the chart header. Pick the Flow category and choose Delta Histogram. Click Add. Double-click the indicator (or use its gear) to open the settings. Or ask the AI Assistant: "add the Delta Histogram".
Related indicators
Big Trades
Marks the LARGE trades on the chart (ATAS-style sweep).
real screenshotAbsorption
Absorption: aggression that does NOT move price — Big Trades' sibling, but for whoever is HOLDING.
real screenshotTrend Pressure
Trend line driven by PRESSURE (EMA base + pressure×ATR) with signals.
real screenshotRSI Levels
Support/resistance created by RSI CROSSES.
real screenshotTry it on your own chart
Every feature on every plan — 6 months, 1 year or lifetime.
See plans & pricing