
Averages
Bollinger Bands
Standard-deviation bands around a moving average.
Real example in the platform
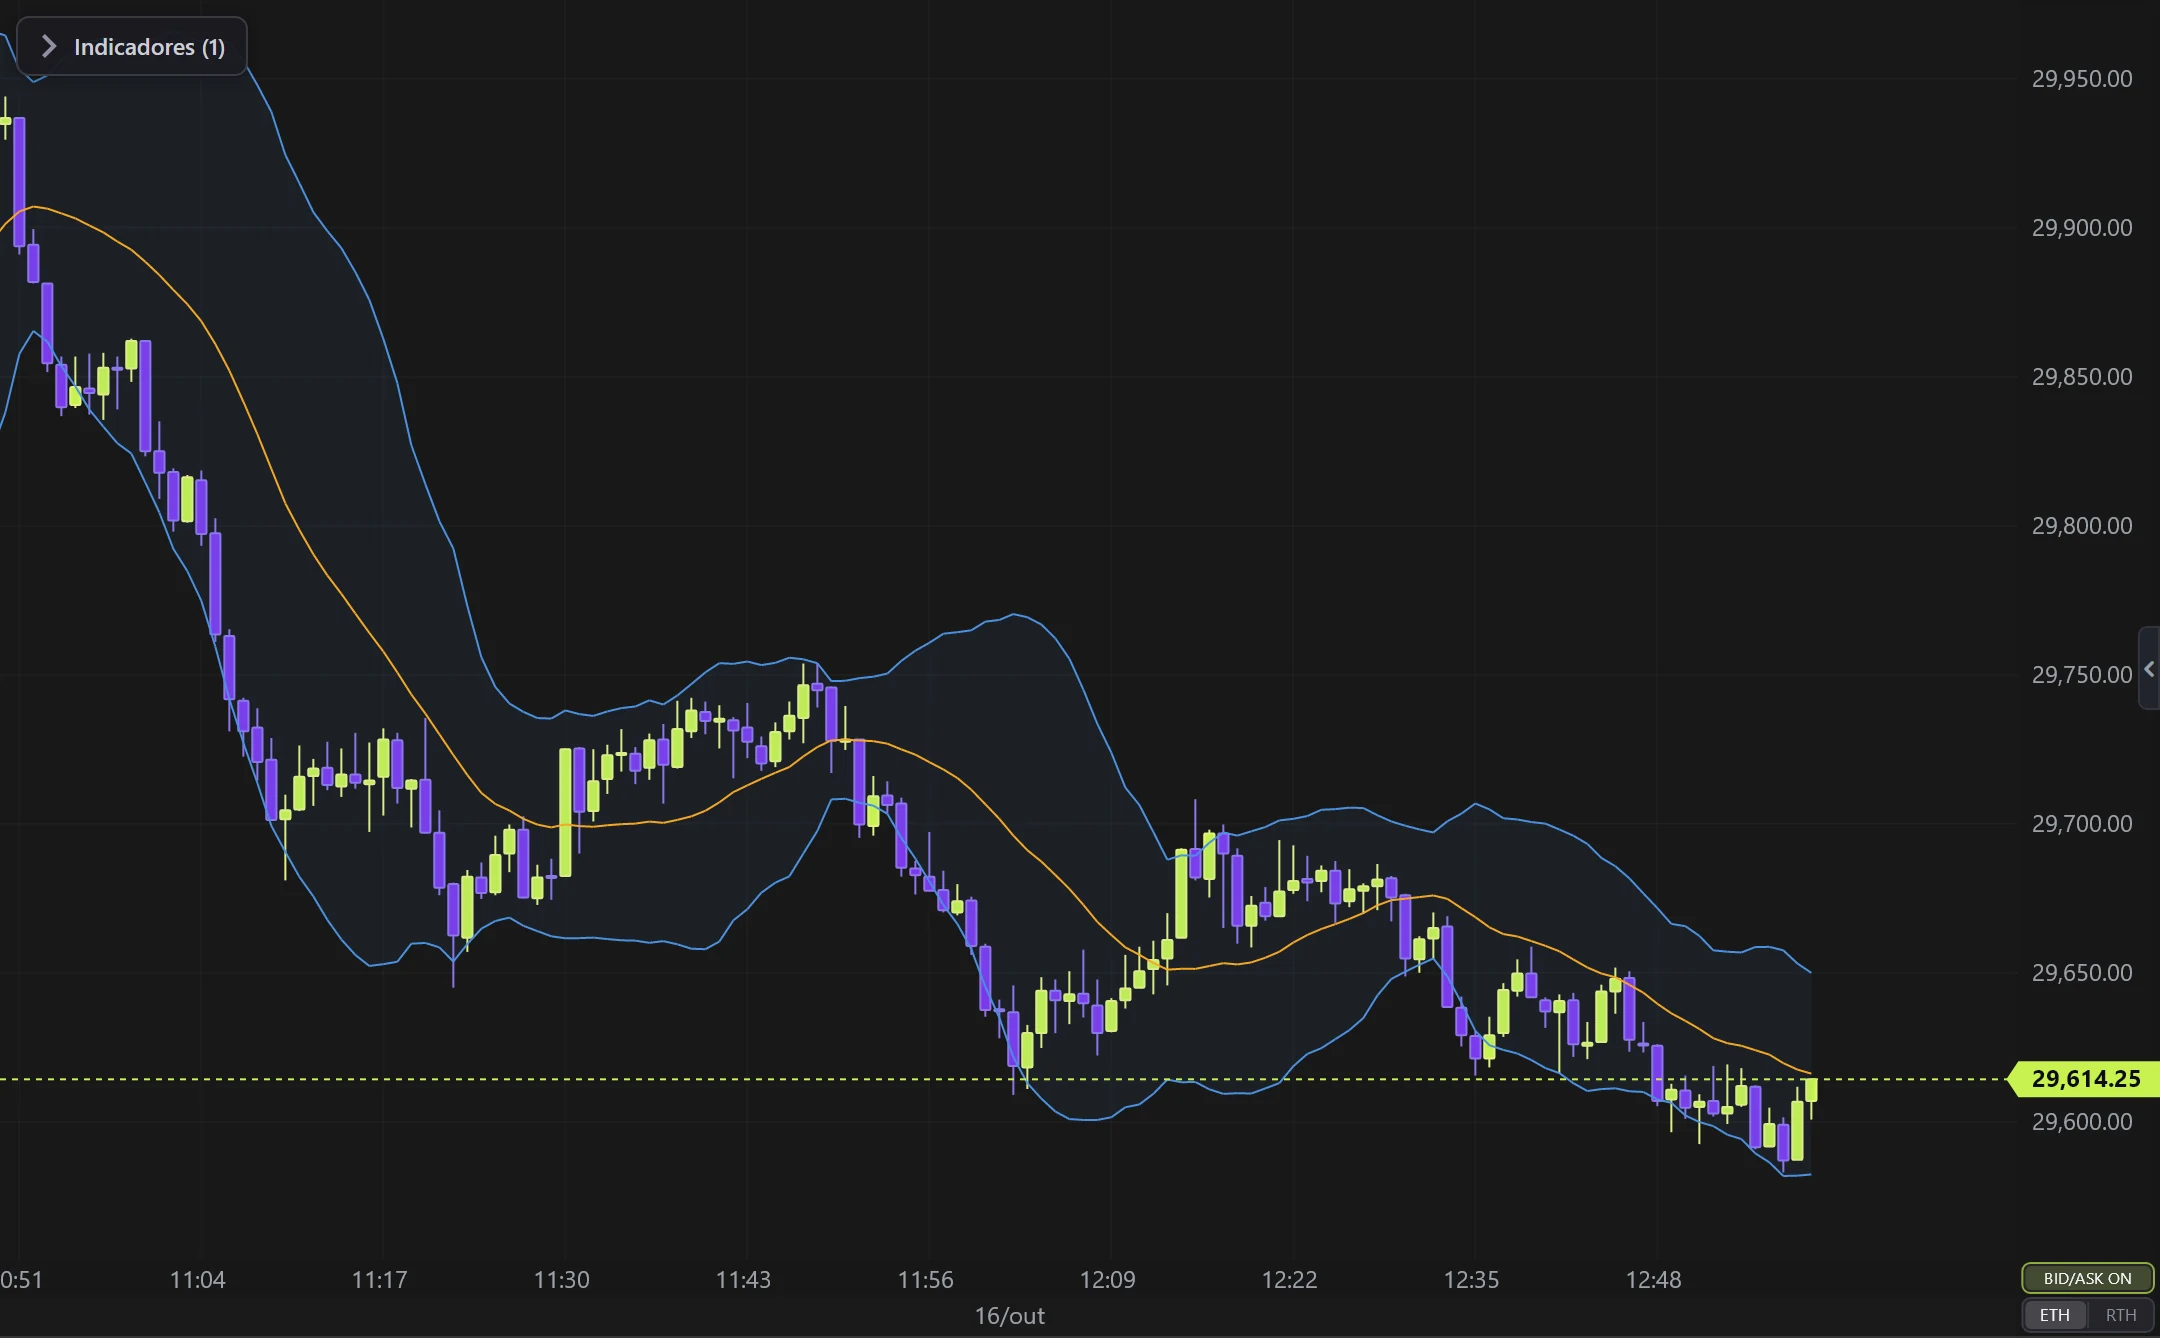
Bollinger Bands on the NQ, 1-minute candles built from real ticks (October 16, 2026, Rithmic feed) — a screenshot of the platform itself, factory settings.
What it does
- Middle line = average (SMA/EMA); bands = average ± N standard deviations.
- Price at the bands = stretched (volatility); a band squeeze = compression before expansion.
Options
- Period, multiplier (nº of deviations), SMA/EMA type, colors and fill.
Settings
Everything you can change in the indicator's settings dialog, in the same order as in the platform:
- Type
- Period
- Multiplier (deviations)
- Thickness
- Colors
- Middle line
- Bands
- Fill between bands
- Fill opacity
- Calculation source (another candle type/timeframe)
How to add it in EliteXCharts
- Open a chart and click the Indicators icon in the chart header.
- Pick the Averages category and choose Bollinger Bands.
- Click Add. Double-click the indicator (or use its gear) to open the settings.
- Or ask the AI Assistant: "add the Bollinger Bands".
Frequently asked questions
What does the Bollinger Bands indicator do?
Standard-deviation bands around a moving average. Middle line = average (SMA/EMA); bands = average ± N standard deviations. Price at the bands = stretched (volatility); a band squeeze = compression before expansion.
How do you read the Bollinger Bands?
Period, multiplier (nº of deviations), SMA/EMA type, colors and fill.
How do I add the Bollinger Bands to a chart in EliteXCharts?
Open a chart and click the Indicators icon in the chart header. Pick the Averages category and choose Bollinger Bands. Click Add. Double-click the indicator (or use its gear) to open the settings. Or ask the AI Assistant: "add the Bollinger Bands".
Related indicators
Moving Average
Classic moving average of the close.
real screenshotDouble MA
Two averages (fast + slow) with a colored cloud between them.
real screenshotEMA Trend 27/55
Two EMAs (default 27/55) that define the trend and PAINT the candles.
real screenshotKeltner Channels
ATR channel around an EMA (Bollinger's smoother sibling).
real screenshotTry it on your own chart
Every feature on every plan — 6 months, 1 year or lifetime.
See plans & pricing