
Structure
Open % Levels
PERCENTAGE lines measured from the session's OPENING price.
Real example in the platform
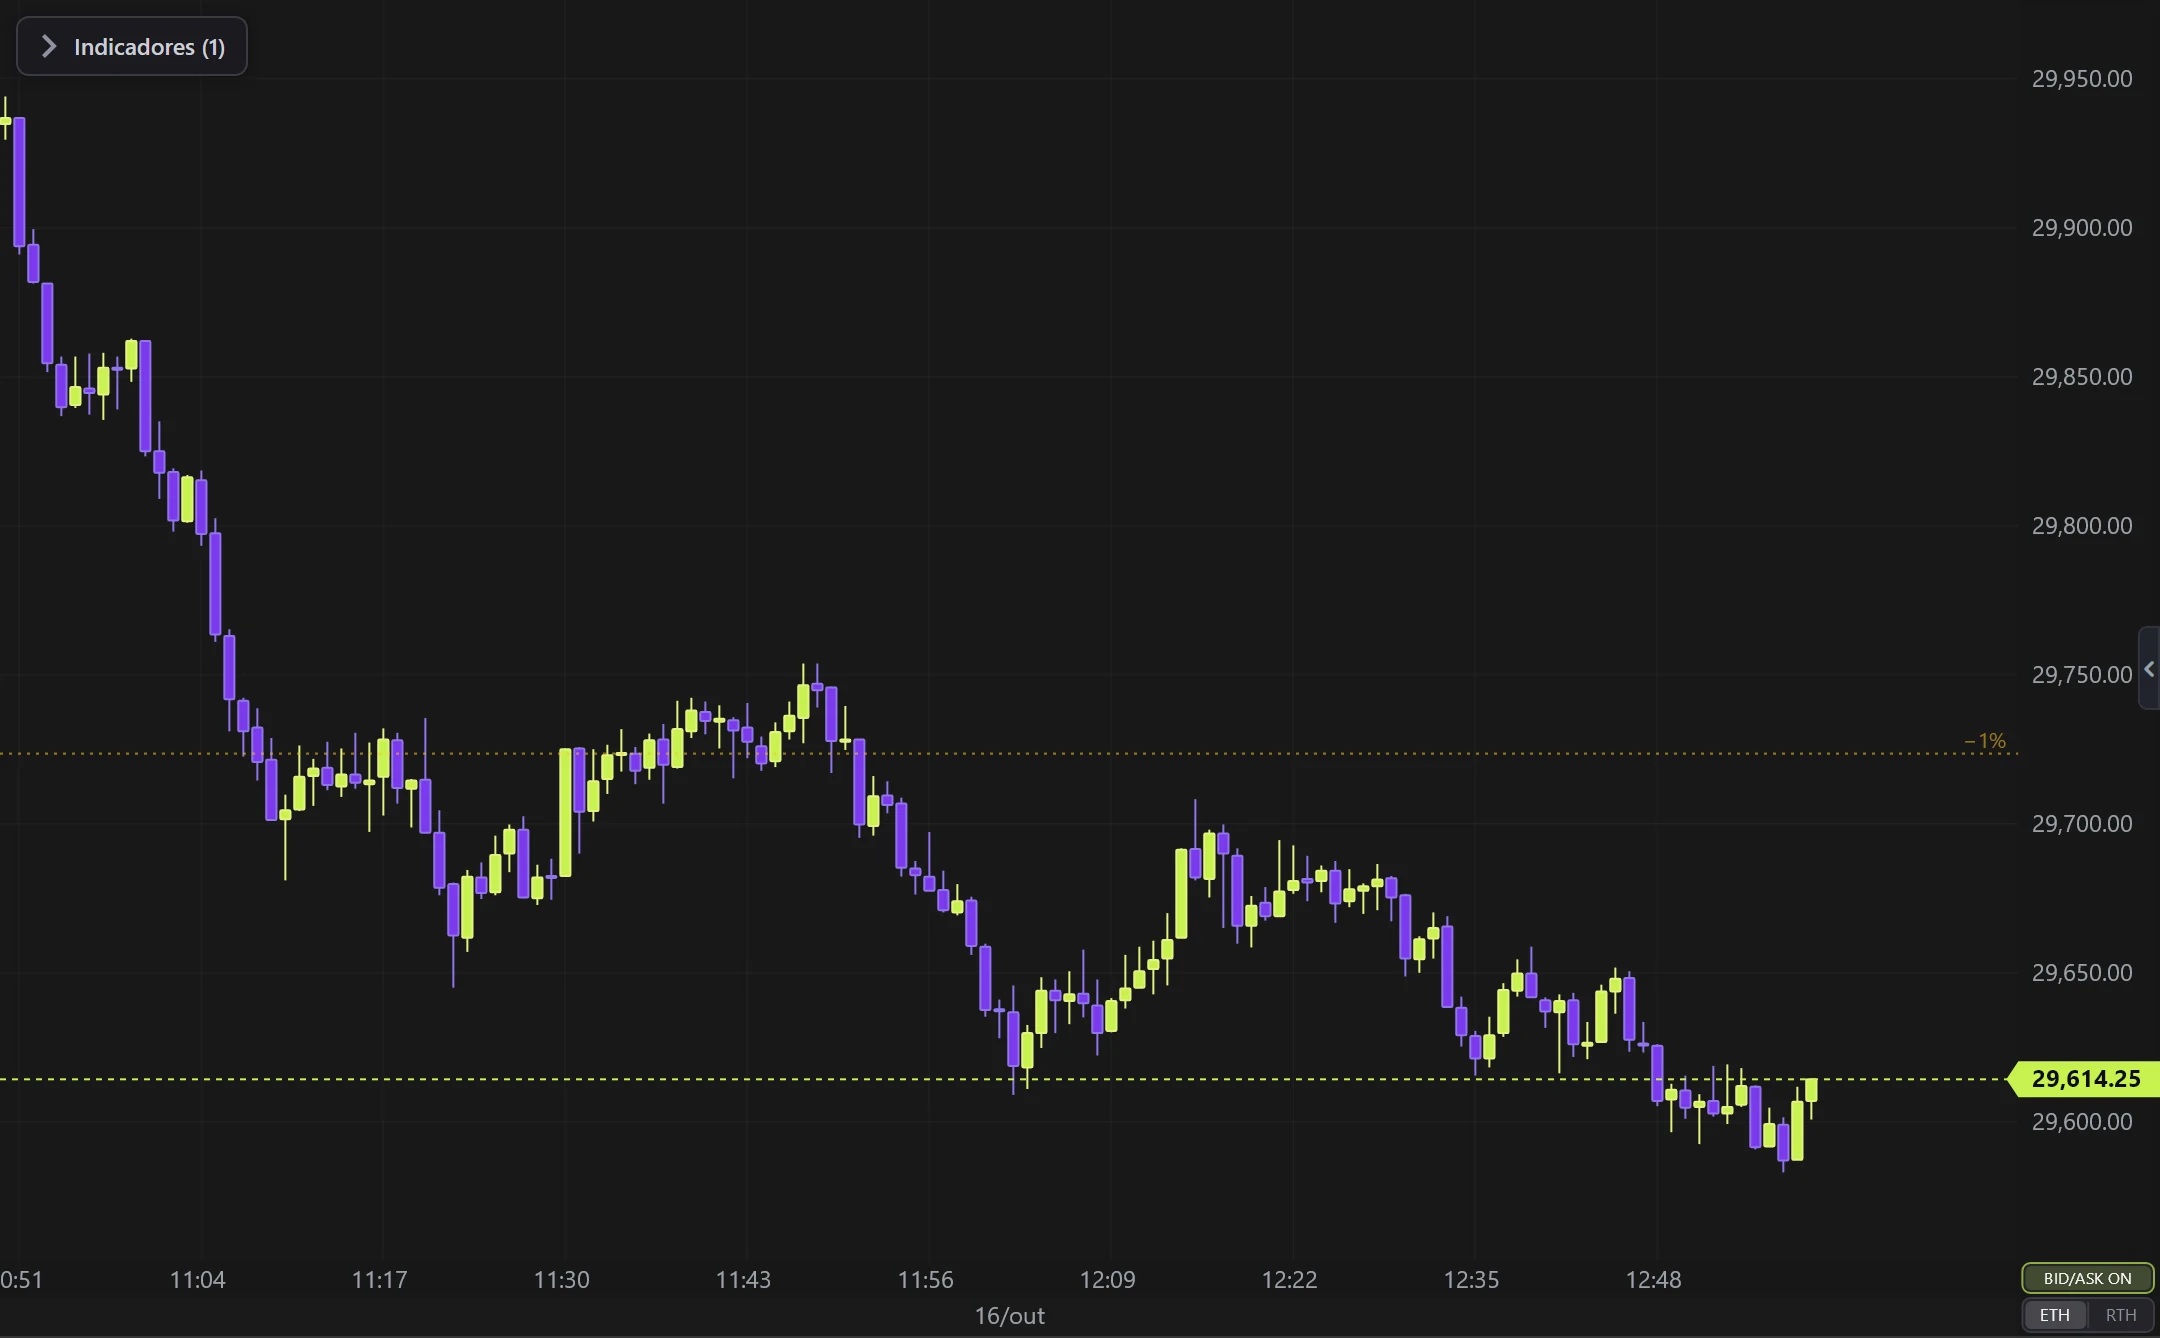
Open % Levels on the NQ, 1-minute candles built from real ticks (October 16, 2026, Rithmic feed) — a screenshot of the platform itself, factory settings.
What it does
- Draws 1%, 2%… up to 5% (configurable) above and below the open, dotted.
- ANCHOR: RTH open (9:30 ET) or session/ETH open (18:00 ET, Globex) — RTH measures what the floor did since the bell; ETH includes what the overnight had already delivered.
- HEAT: the farther from the open, the stronger the colour — you can tell how far price has run without reading a label.
Options
- Step in % and number of levels, near and far colours, dash, thickness and the opening line itself.
Settings
Everything you can change in the indicator's settings dialog, in the same order as in the platform:
- RTH open (9:30)
- Session / ETH open (18:00)
- Anchor
- Step (%)
- Levels per side
- Sessions (1 = current only)
- Show the opening line
- Show labels
- Colors
- Nearest level colour
- Farthest level colour
- Opening colour
- Dash
- Thickness
- Opening thickness
- Session times
- RTH open (ET minutes)
- RTH close (ET minutes)
- Session start (ET minutes)
How to add it in EliteXCharts
- Open a chart and click the Indicators icon in the chart header.
- Pick the Structure category and choose Open % Levels.
- Click Add. Double-click the indicator (or use its gear) to open the settings.
- Or ask the AI Assistant: "add the Open % Levels".
Frequently asked questions
What does the Open % Levels indicator do?
PERCENTAGE lines measured from the session's OPENING price. Draws 1%, 2%… up to 5% (configurable) above and below the open, dotted. ANCHOR: RTH open (9:30 ET) or session/ETH open (18:00 ET, Globex) — RTH measures what the floor did since the bell; ETH includes what the overnight had already delivered. HEAT: the farther from the open, the stronger the colour — you can tell how far price has run without reading a label.
How do you read the Open % Levels?
Step in % and number of levels, near and far colours, dash, thickness and the opening line itself.
How do I add the Open % Levels to a chart in EliteXCharts?
Open a chart and click the Indicators icon in the chart header. Pick the Structure category and choose Open % Levels. Click Add. Double-click the indicator (or use its gear) to open the settings. Or ask the AI Assistant: "add the Open % Levels".
Related indicators
Swing Highs & Lows
Marks the structural PIVOTS (swing highs and lows) on Renko.
real screenshotHigher Timeframes (right)
Candles of HIGHER timeframes in a strip on the right side.
real screenshotAMD Cycle
Accumulation → Manipulation → Distribution cycle over the HIGHER timeframe candle.
real screenshotHTF Power of Three
The candles of a HIGHER timeframe on the right of the chart, the last one forming live: ICT's Power of Three…
real screenshotTry it on your own chart
Every feature on every plan — 6 months, 1 year or lifetime.
See plans & pricing