
Momentum
MACD
Classic MACD in ITS OWN PANEL below the chart.
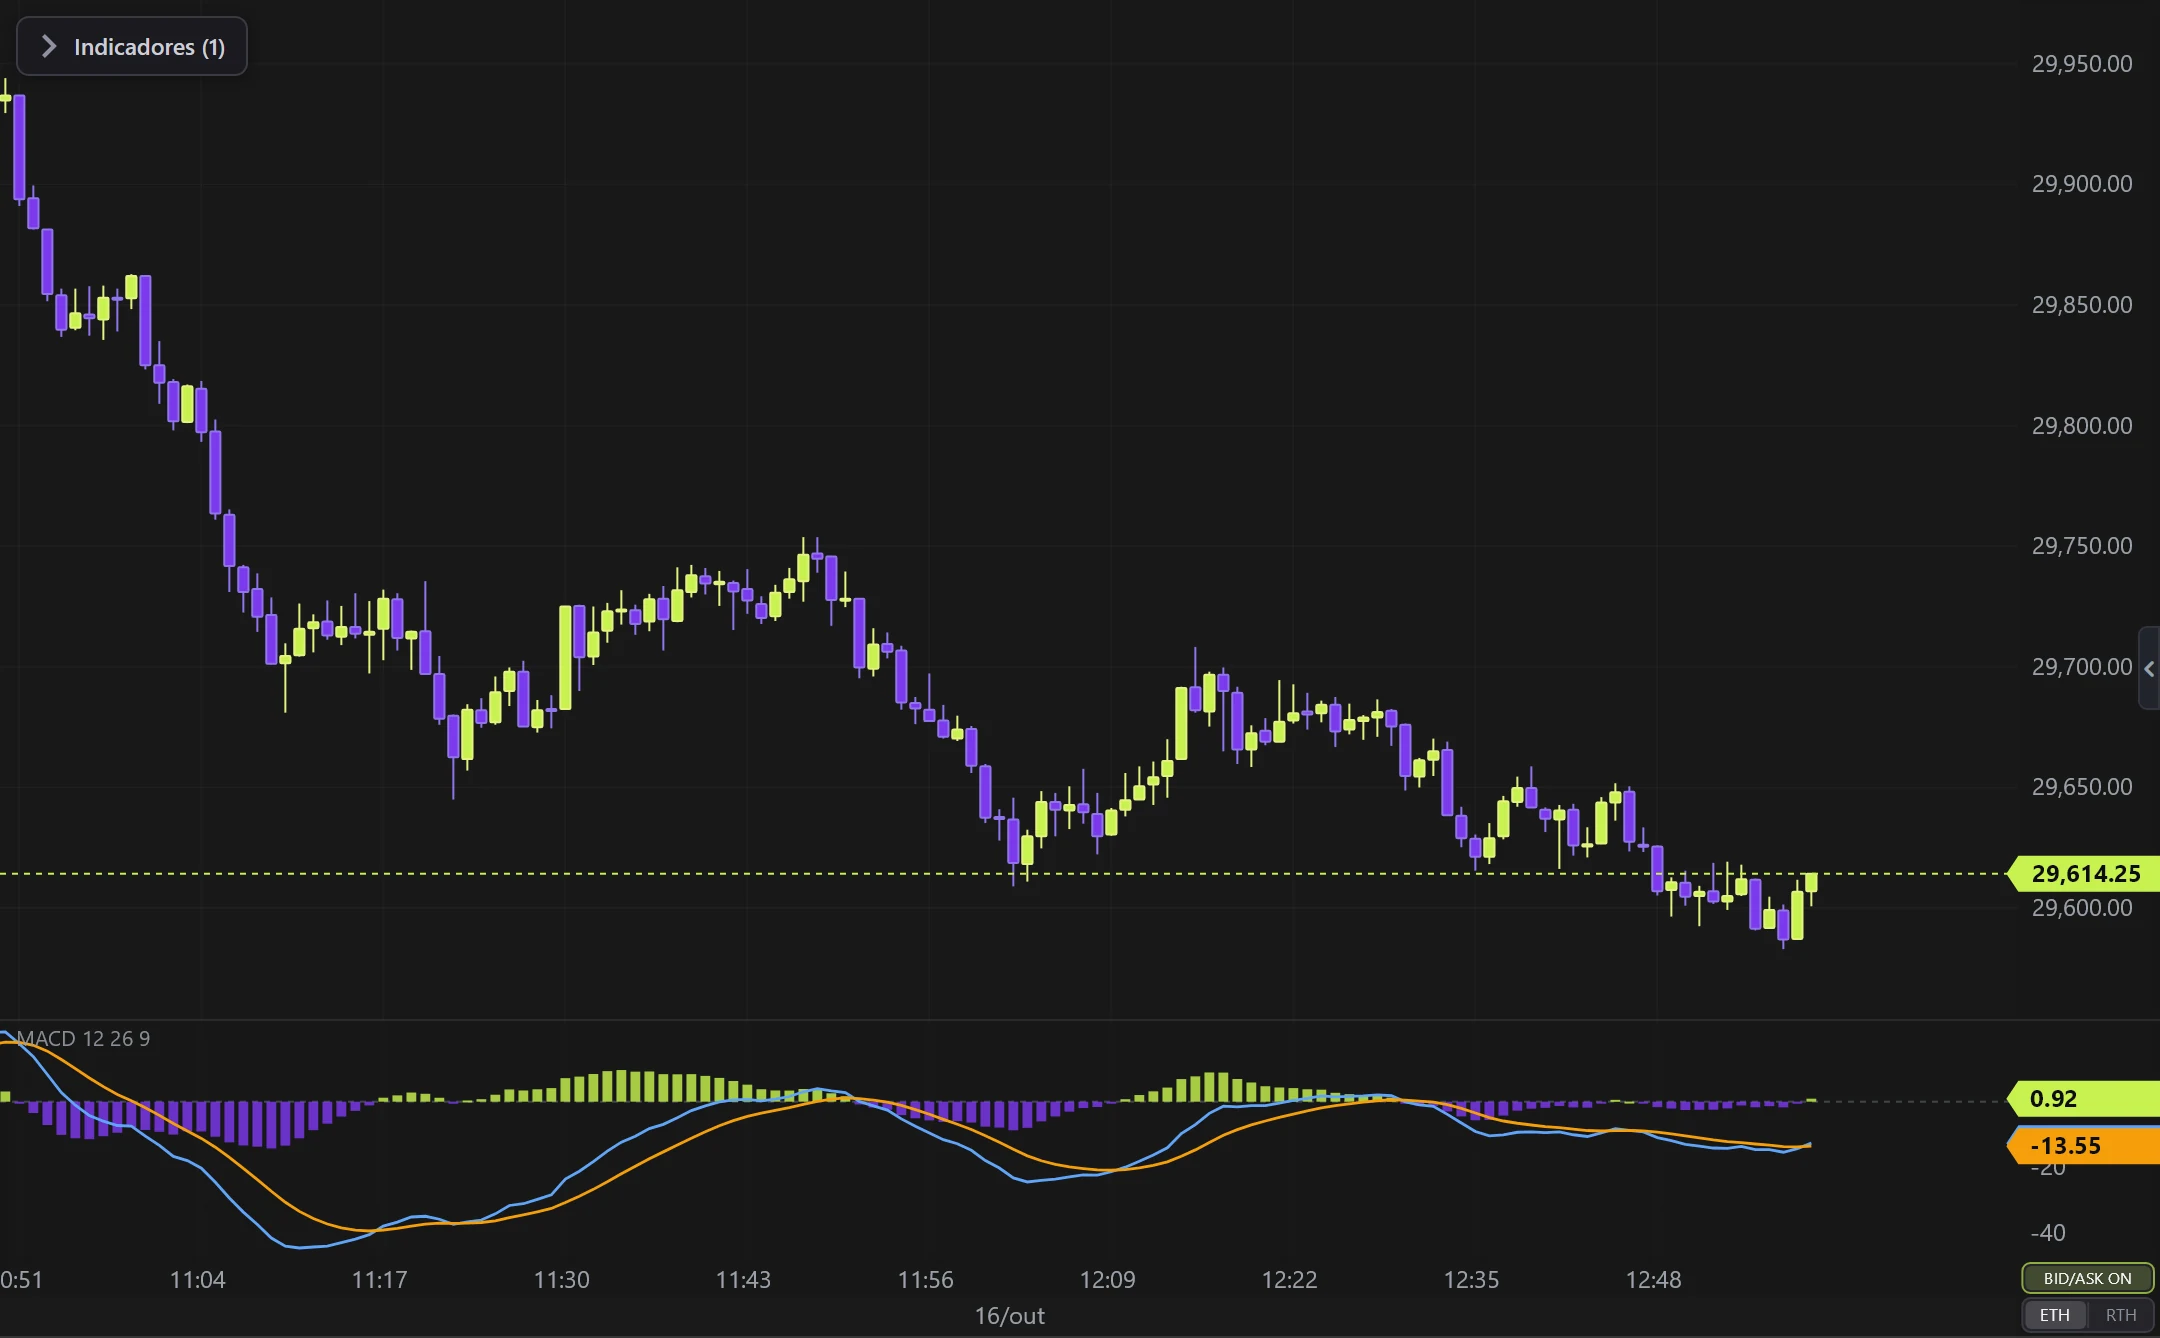
Real example in the platform
MACD on the NQ, 1-minute candles built from real ticks (October 16, 2026, Rithmic feed) — a screenshot of the platform itself, factory settings.
What it does
- MACD line (fast EMA − slow EMA) + SIGNAL line (EMA of MACD).
- HISTOGRAM (MACD − signal) with separate colors ABOVE and BELOW zero.
- Optional EXTRA moving average (SMA or EMA) over the MACD line.
Interaction
- Double-click the panel for settings · right-click for the menu · drag the splitter to resize.
Options
- Periods, every color, panel height and opacity.
Settings
Everything you can change in the indicator's settings dialog, in the same order as in the platform:
- Fast EMA
- Slow EMA
- Signal
- Pane height (px)
- Background blur
- Background opacity
- Histogram
- Show
- Color ABOVE 0
- Color BELOW 0
- Lines
- MACD line
- MACD line color
- Signal line
- Signal line color
- Zero line color
- Extra MA (over MACD line)
- Enable
- Type
- SMA
- EMA
- Period
- Color
- Paint candles
- Calculation source (another candle type/timeframe)
How to add it in EliteXCharts
- Open a chart and click the Indicators icon in the chart header.
- Pick the Momentum category and choose MACD.
- Click Add. Double-click the indicator (or use its gear) to open the settings.
- Or ask the AI Assistant: "add the MACD".
Frequently asked questions
What does the MACD indicator do?
Classic MACD in ITS OWN PANEL below the chart. MACD line (fast EMA − slow EMA) + SIGNAL line (EMA of MACD). HISTOGRAM (MACD − signal) with separate colors ABOVE and BELOW zero. Optional EXTRA moving average (SMA or EMA) over the MACD line.
How do you read the MACD?
Double-click the panel for settings · right-click for the menu · drag the splitter to resize.
How do I add the MACD to a chart in EliteXCharts?
Open a chart and click the Indicators icon in the chart header. Pick the Momentum category and choose MACD. Click Add. Double-click the indicator (or use its gear) to open the settings. Or ask the AI Assistant: "add the MACD".
Related indicators
Try it on your own chart
Every feature on every plan — 6 months, 1 year or lifetime.
See plans & pricing