
Volatility
ATR
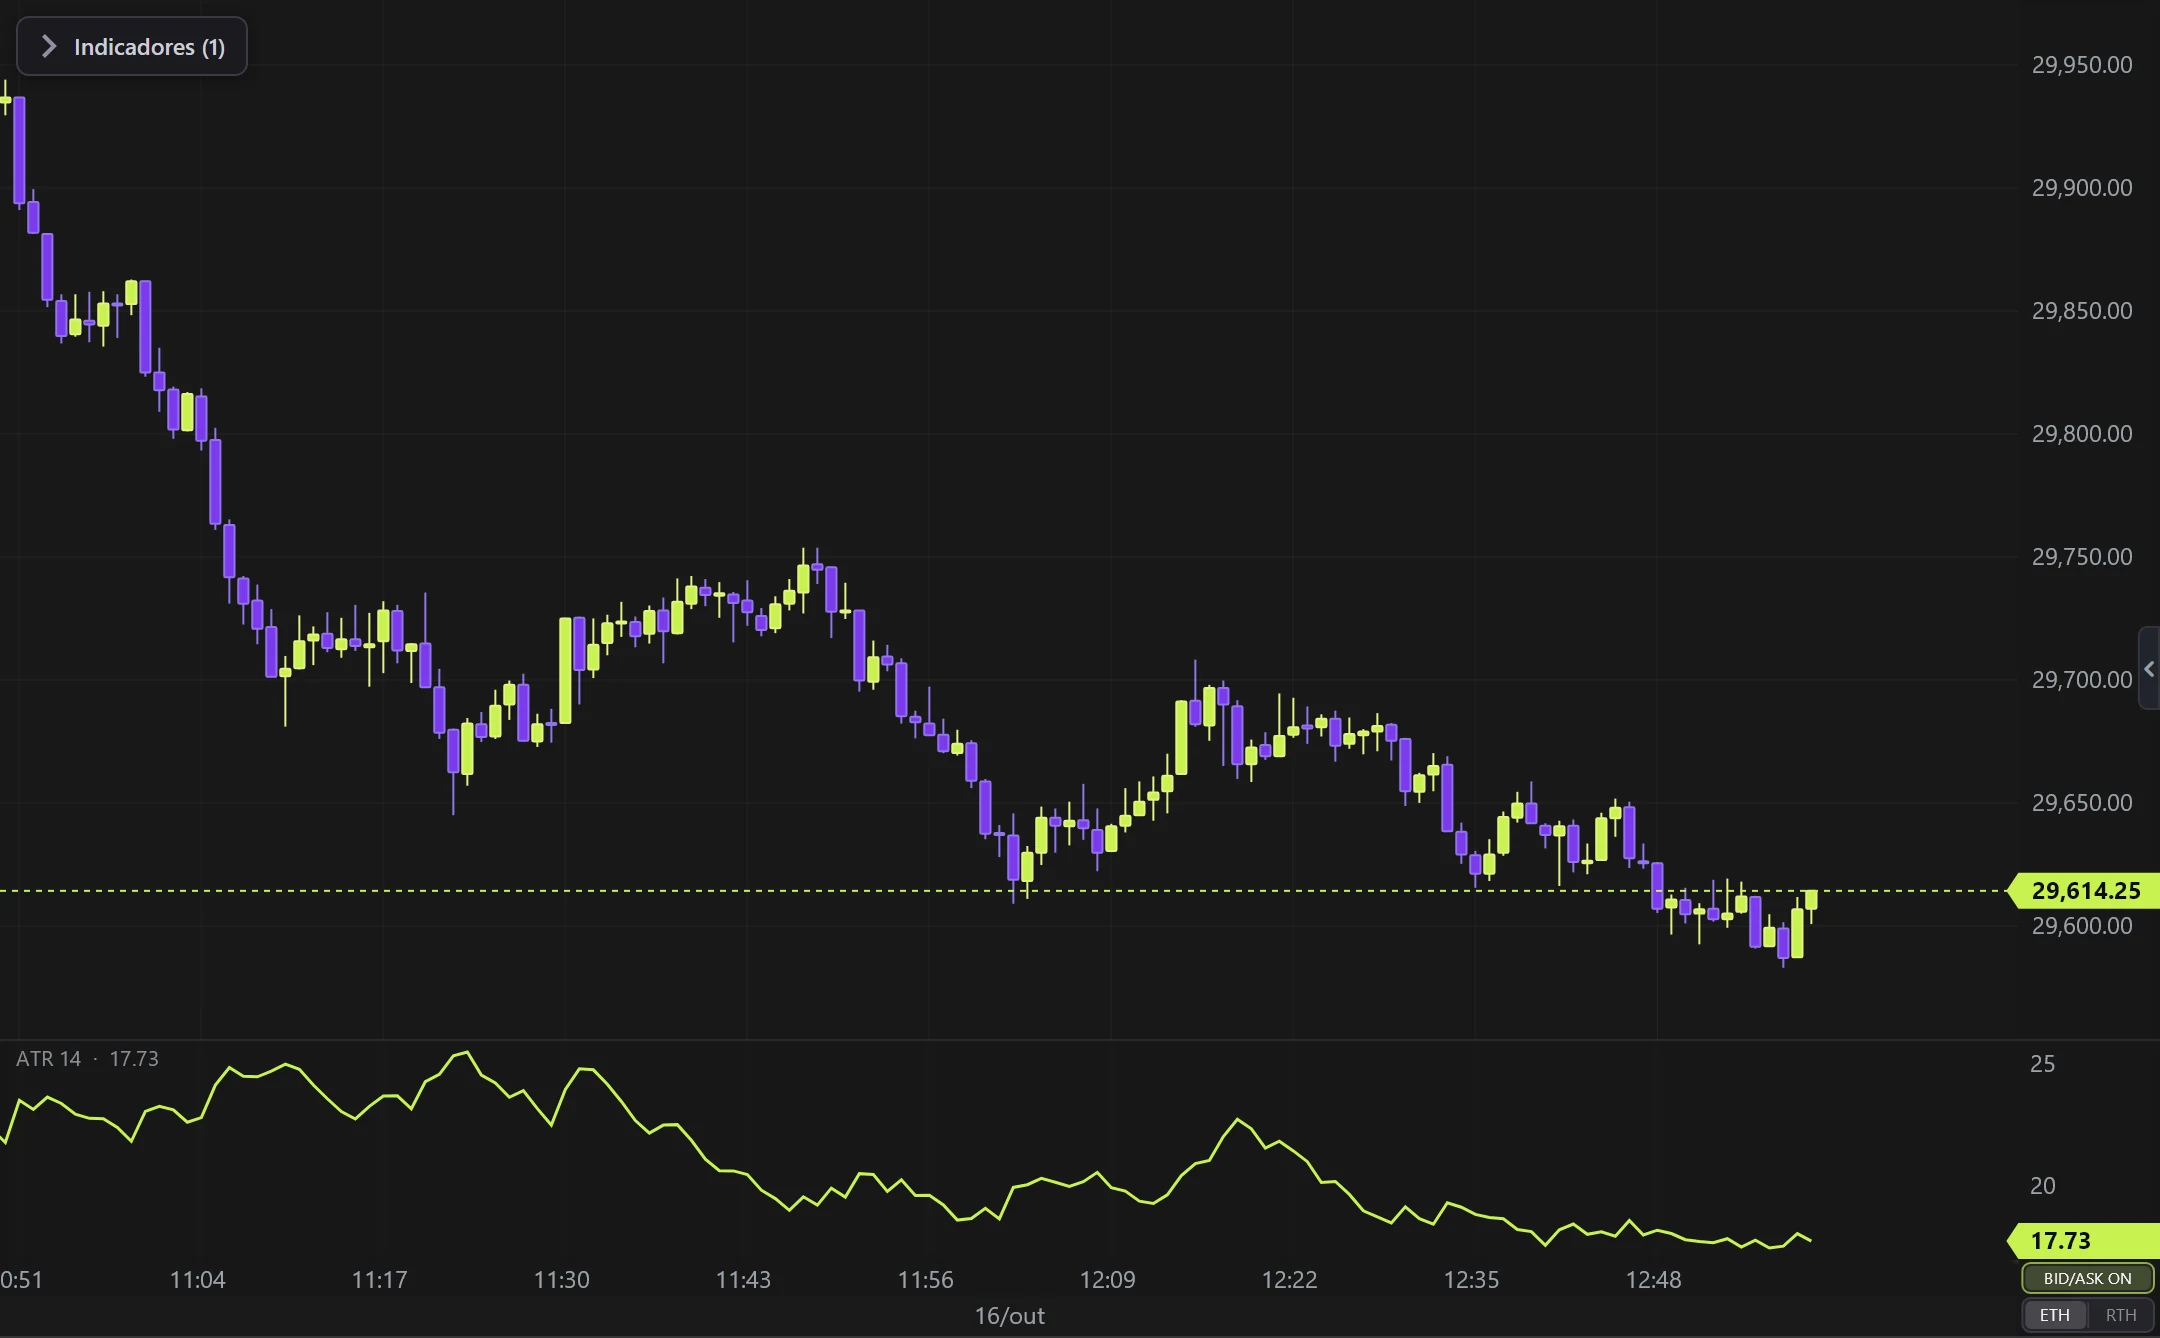
Average True Range in ITS OWN PANEL below the chart.
Real example in the platform
ATR on the NQ, 1-minute candles built from real ticks (October 16, 2026, Rithmic feed) — a screenshot of the platform itself, factory settings.
What it does
- Measures average volatility (Wilder smoothing of the True Range).
- ATR line + optional moving average over it.
Options
- Period, colors and panel height.
Settings
Everything you can change in the indicator's settings dialog, in the same order as in the platform:
- Period
- Pane height (px)
- Background blur
- Background opacity
- Line
- Color
- Thickness
- Extra MA (over ATR)
- Enable
- Type
- SMA
- EMA
- Period
- Calculation source (another candle type/timeframe)
How to add it in EliteXCharts
- Open a chart and click the Indicators icon in the chart header.
- Pick the Volatility category and choose ATR.
- Click Add. Double-click the indicator (or use its gear) to open the settings.
- Or ask the AI Assistant: "add the ATR".
Frequently asked questions
What does the ATR indicator do?
Average True Range in ITS OWN PANEL below the chart. Measures average volatility (Wilder smoothing of the True Range). ATR line + optional moving average over it.
How do you read the ATR?
Period, colors and panel height.
How do I add the ATR to a chart in EliteXCharts?
Open a chart and click the Indicators icon in the chart header. Pick the Volatility category and choose ATR. Click Add. Double-click the indicator (or use its gear) to open the settings. Or ask the AI Assistant: "add the ATR".
Try it on your own chart
Every feature on every plan — 6 months, 1 year or lifetime.
See plans & pricing